Test- FTSE 100 Kicks Off August on a High as BP and Senior Lead Market Momentum
$11
10 Oct 2025, 13:13
Neutral
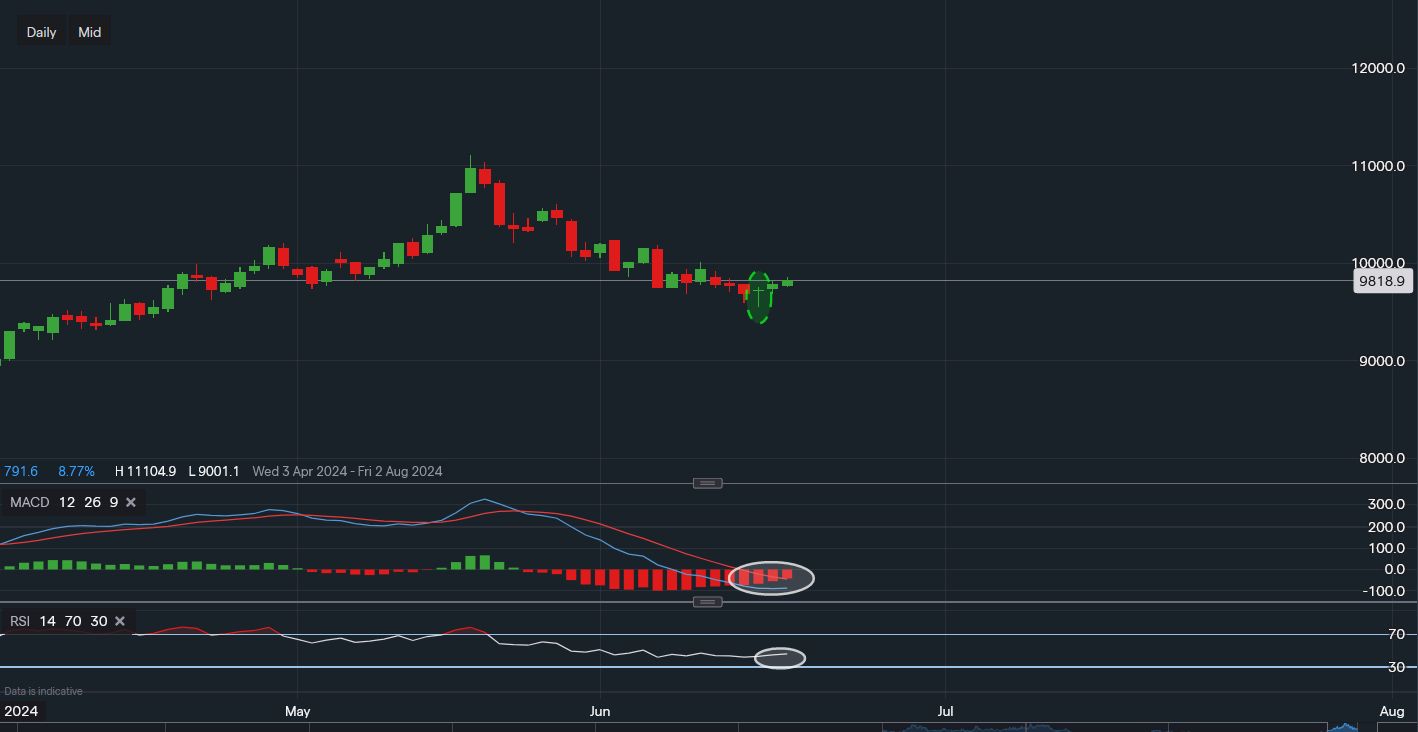
Chart & Data from IG
Taking a look at the price of copper as the retracement following a test of all-time highs may now be nearing its end. Currently, the base metal trades at around $9,818/T. Looking at the daily chart, we can see a hammer candlestick formed earlier in the week on Tuesday, suggesting bullish price momentum. With the metal closing yesterday’s session in the green, it is currently heading for its third consecutive green day. Therefore, the support for the near term is Tuesday’s low of $9,551. A break and close below this could spur a sell-off towards the area of $9,200-$9,300. However, looking at the resistance here now due to this potential setup, $10,014 will be the level bulls need to keep their eye on. A break and close above could pave the way for a new rally towards $10,200-$10,400. The technical indicators show signs of consolidation as the MACD line looks like it is trying to bottom out and the RSI has moved into a neutral position.

Tradable assets:
Min.Deposit:
Max Leverage:
FCA:

Rating:


