Test- FTSE 100 Kicks Off August on a High as BP and Senior Lead Market Momentum
$11
10 Oct 2025, 13:13
Neutral
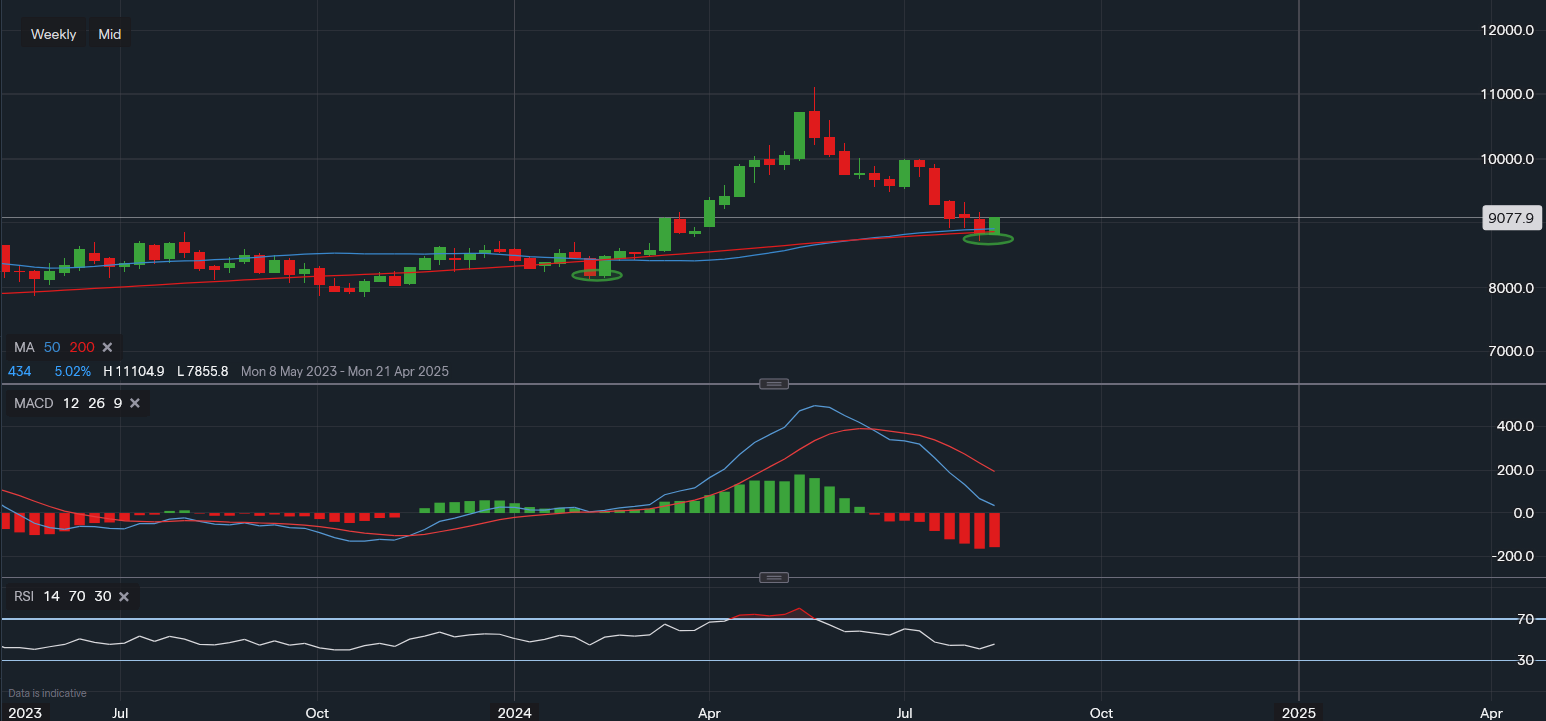
Chart & Data from IG
A sufficient enough bounce so far here for Copper on the weekly chart off the 50 and 200-day moving averages. After falling to a low of $8,713 last week due to demand pressure from China (weaker), the base metal is now trading at around $9,077 per tonne and is up 1.5% on the day. The moving averages are clearly providing robust support here for the near term, a move below could spark another round of selling. But a break below the low of $8,713 would be needed for greater confidence. Back in February when the price of copper dipped below the moving averages, this then became an interim bottom for the 35% rally during spring, trough to peak. Therefore, the recent pullback of 20% could now be providing an opportunity for longer-term bulls. In the scenario where $8,713 is the new higher low before another leg higher, anticipating another 35%, this would take the price of copper to just shy of $12,000 a tonne over the longer-term outlook. Towards the upside, the resistance sits around $9,182 and then at $9,551. A move above $9,551 would likely increase the optimism amongst investors/traders after the recently low volume experienced by the base metal. Based on a technical/momentum view, the MACD is still largely negative and so is the RSI, hence, this creates a higher risk to reward for the time being. Signs of consolidation over the coming weeks may provide greater confidence. Though the RSI is now starting to creep up.

Tradable assets:
Min.Deposit:
Max Leverage:
FCA:

Rating:


