Test- FTSE 100 Kicks Off August on a High as BP and Senior Lead Market Momentum
$11
10 Oct 2025, 13:13
Neutral
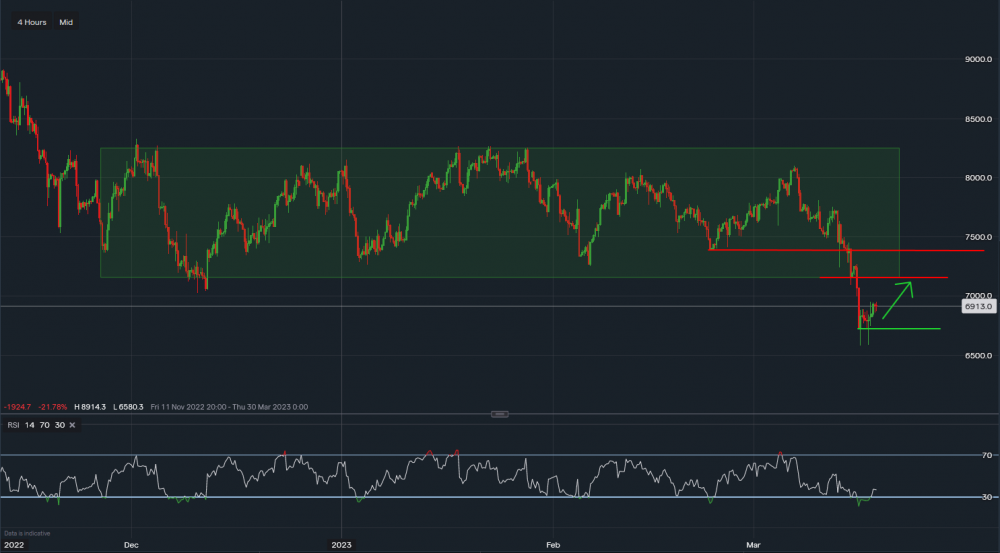
Crude Oil - Chart & Data from IG
Oil fall over 8% on Wednesday & Thursday as bank fear shook the commodity market. This has been the worst week of the year so far however, as the banks have started to resolve themselves the oil market seems ti have stabilised forming a temporary base at $67 (green line). It is worth noting from our previous post, that oil has now moved below the range dating back to late November, so this could be a trend change towards the downside. Looking at the chart, resistance now sits at $71.50. A daily break and close above here could take the market back into its range with $74 on the cards thereafter. Toward the downside, if the market cannot hold the support of $67, then the next level of support sits at the Aug & December lows at $62. Chinese demand will come back into Q3 & Q4 as per analyst forecast, so the downside is likely limited unless inflation gets worse. RSI reads 35 on the 4 hourly with MACD just recently turning positive.

Tradable assets:
Min.Deposit:
Max Leverage:
FCA:

Rating:


