Test- FTSE 100 Kicks Off August on a High as BP and Senior Lead Market Momentum
$11
10 Oct 2025, 13:13
Neutral
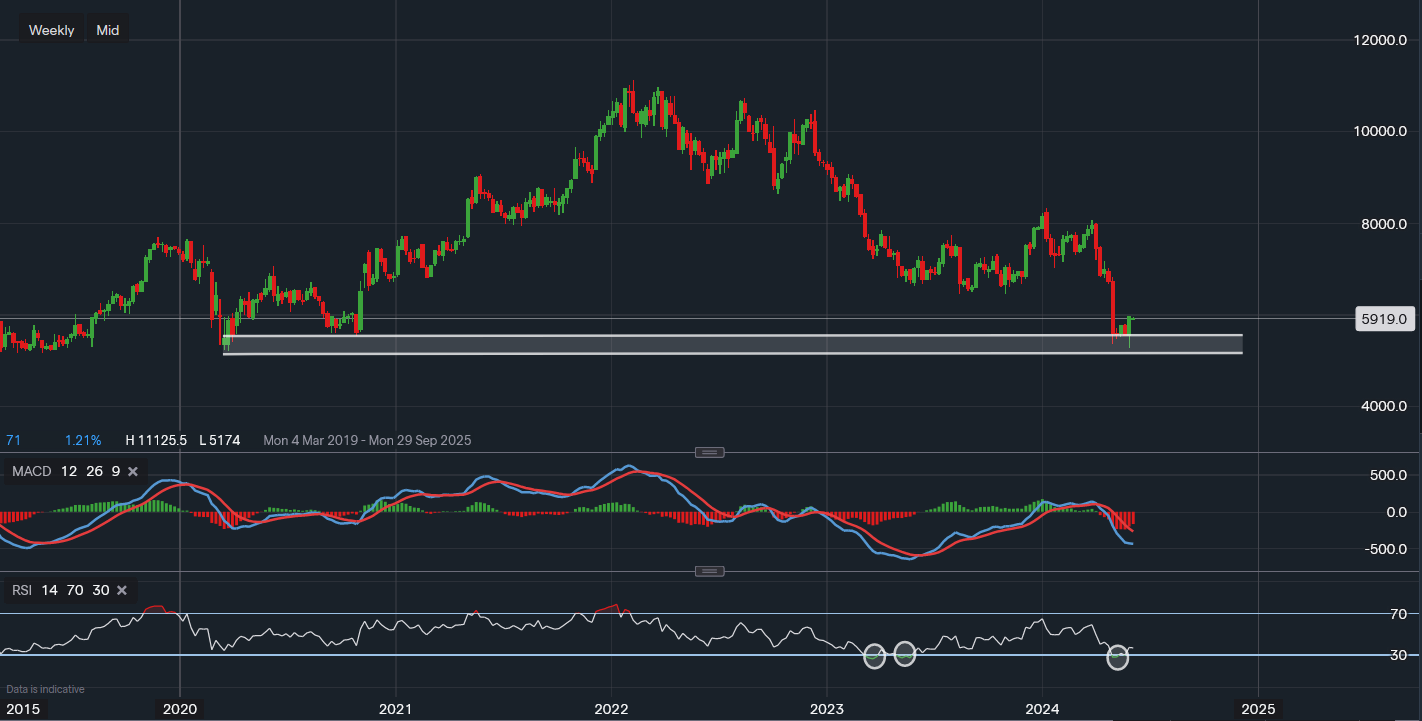
Chart & Data from IG
CVS Health Corp may have found some support here on the weekly chart after the deep sell-off following its earnings earlier in the year. Currently, its stock is trading at around $59.19 a share so far on the first trading day of June. We can see the price has tested the support that was created back in 2020 between March and October, the stock tested the October lows, and last week we saw an influx of buyers rushing. As a result, the week finished with a strong candlestick to the upside. The next resistance that buyers will need to overcome is $60.77. A close above this level would create a potential setup for an extension towards the area of $63-$65. We can see that the support area between $52-$55 (white channel) is vital for the stock as a fall below it could lead to a further sell-off, potentially taking the stock to levels not seen since 2012. Looking at the technical indicators, the MACD is still negative but after last week’s strong finish, we can see that the MACD line is trying to now flatten out. Throughout the majority of May, the RSI suggested that the stock was oversold. This contributed to the small bounce higher in price, as we can see that in the past when the RSI fell into oversold conditions, the price of the stock moved higher for the following 2-3 weeks. However, it is not guaranteed that this will happen again here so investors and traders should take caution.

Tradable assets:
Min.Deposit:
Max Leverage:
FCA:

Rating:


