Test- FTSE 100 Kicks Off August on a High as BP and Senior Lead Market Momentum
$11
10 Oct 2025, 13:13
Neutral
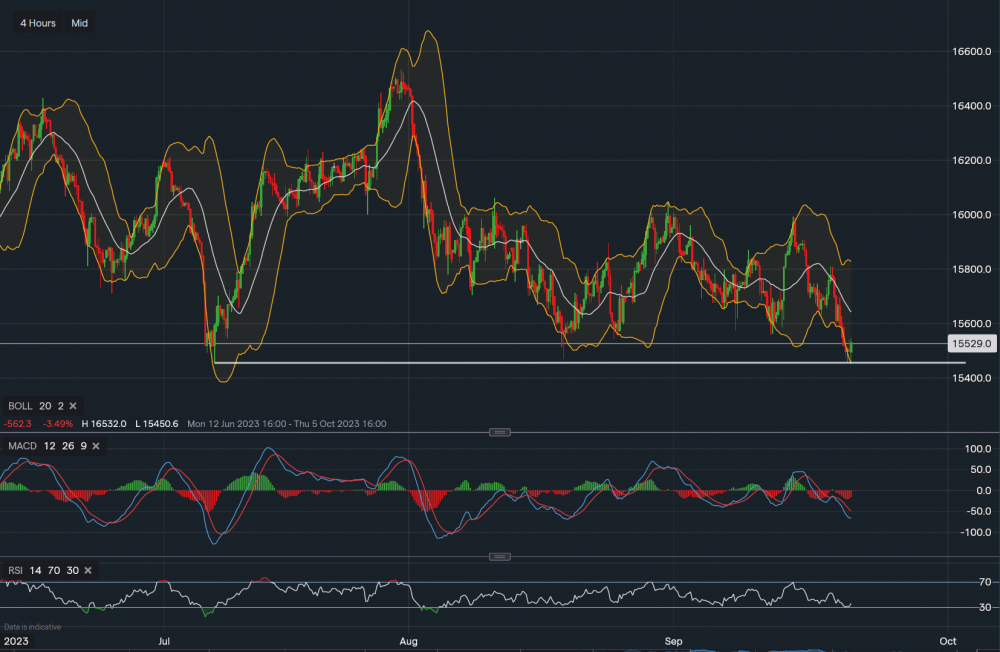
Chart & Data from IG
Just taking a look at the Dax 40 as the index has been falling for the majority of the week and now reached a key support zone, currently trading at around 15,529. If we look at the chart on the 4-hourly interval, we can see that the Dax has now reached a key support level, which is highlighted by the white horizontal trendline. The index came close to testing this support level which reads 15,455, but never touched it as it bounced back after registering 15,458. A break below 15,455 could see a further move lower towards 15,350-15,300. Furthermore, if we apply the Bollinger Bands to the chart, we can see that it has also connected with the lower Bollinger Band and bounced off it, suggesting that we may see some consolidation before a potential correction higher. Looking at the resistance above, minor resistance sits at 15,539. A break and close above it could see the index climb higher with the following resistance levels sitting at 15,589 and then 15,640 (middle average of the BBs). However, the technical indicators remain negative as the MACD volume remains enlarged and the RSI reads 33. Although, the RSI is trading near ‘oversold’ territory, therefore, the market may attract buyers in the short term.

Tradable assets:
Min.Deposit:
Max Leverage:
FCA:

Rating:


