Test- FTSE 100 Kicks Off August on a High as BP and Senior Lead Market Momentum
$11
10 Oct 2025, 13:13
Neutral
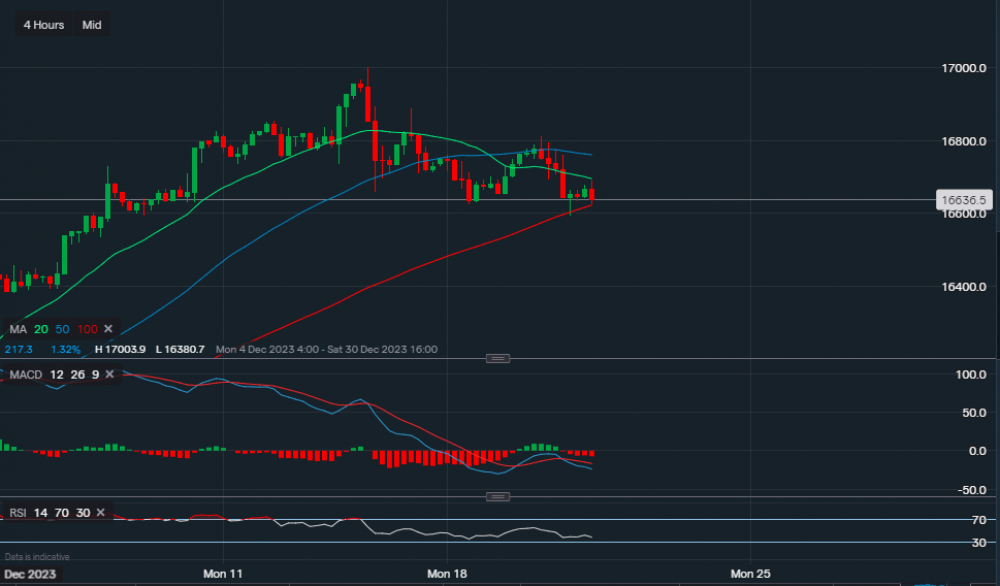
Chart & Data from IG
Taking a look at the Dax 40 as at this moment in time it can be argued that the German index has undergone a retracement. Currently, the index is trading at around 16,636. On the 4 hourly chart, the index has now approached a key level of support, which is the 100-day moving average. We can see that so far it is trying to trade and remain above it, with a bounce off it in yesterday’s session. The support along the 100-day MA reads 16,622, a break below it could lead to a further move lower testing the support of 16,594. Towards the upside, the resistance here is now the 20 & 50-day moving average. The 20-day reads 16,695 and the 50-day reads 17,761. A break above the 50-day would not necessarily suggest that this retracement has come to an end as 16,811 is the point of focus here for the bulls. Looking at the technical indicators, the MACD is negative and so is the RSI as it reads 38.

Tradable assets:
Min.Deposit:
Max Leverage:
FCA:

Rating:


