Test- FTSE 100 Kicks Off August on a High as BP and Senior Lead Market Momentum
$11
10 Oct 2025, 13:13
Neutral
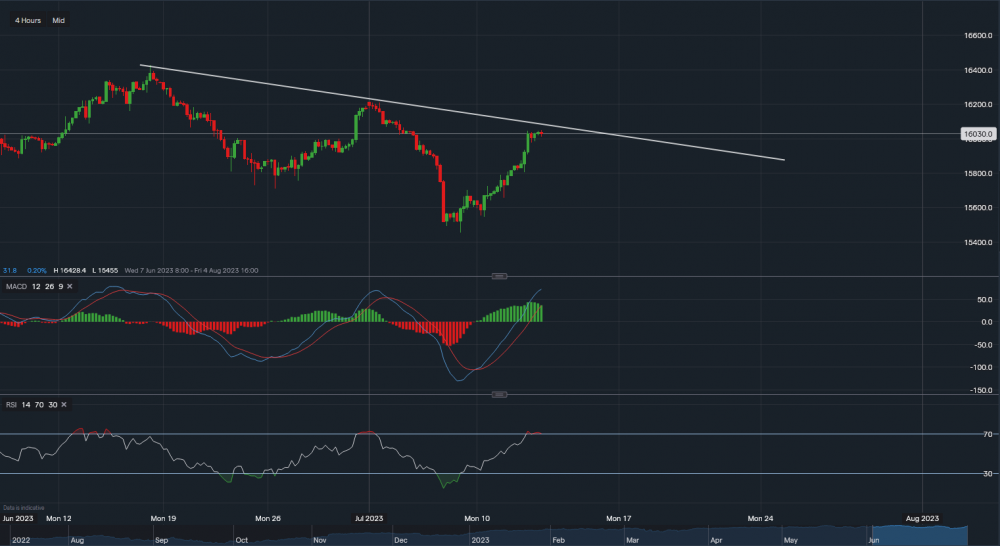
Chart & Data from IG
The Dax is currently trading at around 16,030, we can see that on the 4 hourly timeframe, it is approaching the key resistance level along the descending trendline (at 16,080). A break and close above the trendline could be an indication that the recent bearish trend has ended and a new bullish has started. We then would look towards the resistance levels at 16,108 followed by 16,214. However, traders/investors should be cautious as false breakouts can occur (this is when the chart presents a close above the trendline, tricking the trader to enter and then moves against them. Markets and instruments can be deceiving. Therefore, towards the downside, we would look at the support level sitting at 15,985. A break below this point could see the Dax slide lower with support levels then at 15,917 followed by 15,809. Looking at the technical indicators, MACD is still strongly positive and so is the RSI as it reads 70. However, the RSI is suggesting that the index is slightly overbought, raising the likelihood of a retracement.

Tradable assets:
Min.Deposit:
Max Leverage:
FCA:

Rating:


