Test- FTSE 100 Kicks Off August on a High as BP and Senior Lead Market Momentum
$11
10 Oct 2025, 13:13
Neutral
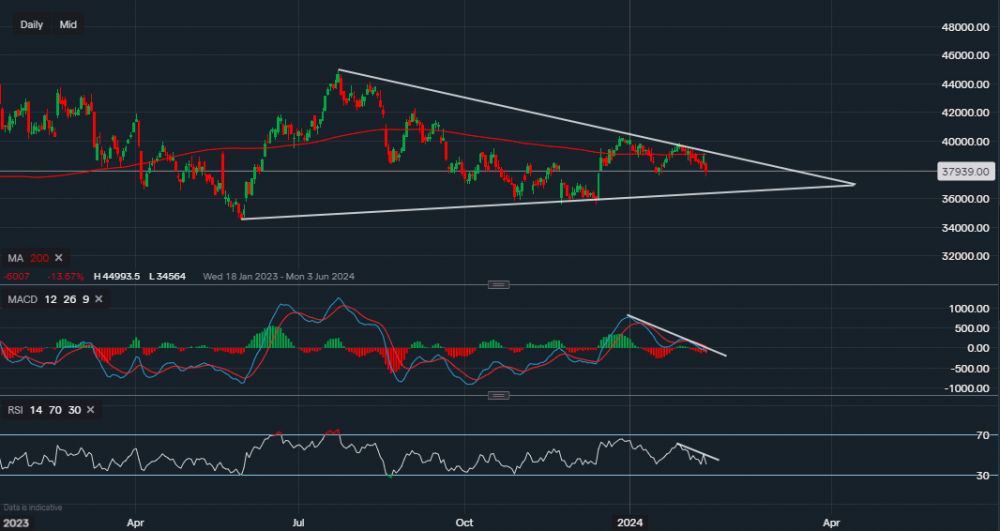
Chart & Data from IG
Deere&Co struggling here to overcome the resistance of its 200-day moving average. We can see that it has attempted to move higher on two separate occasions but has been rejected both times. In theory, this is a bearish indication and could lead to the price falling towards the lower trendline of the triangle. Currently, it’s testing the support of $376.21, if it breaks below this level then a fall towards $364.05 will be likely. The support along the lower trendline, or $364.05 respectively, is crucial so that further downside is limited. The key resistance here is along the upper trendline, reading $389.80, which does slightly correspond with its 200MA. Over to the technical indicators, they paint a similar picture to that of the chart. The MACD is negative and on a decline and so is the RSI as it reads 40. This is also highlighted by the small trendlines on the indicators to show the correlation between the indicator and the price movement of the chart. The company is expected to report an EPS of $5.25 on revenue of $10.37bn. Deere&Co has not missed its earnings since August 2022.

Tradable assets:
Min.Deposit:
Max Leverage:
FCA:

Rating:


