Test- FTSE 100 Kicks Off August on a High as BP and Senior Lead Market Momentum
$11
10 Oct 2025, 13:13
Neutral
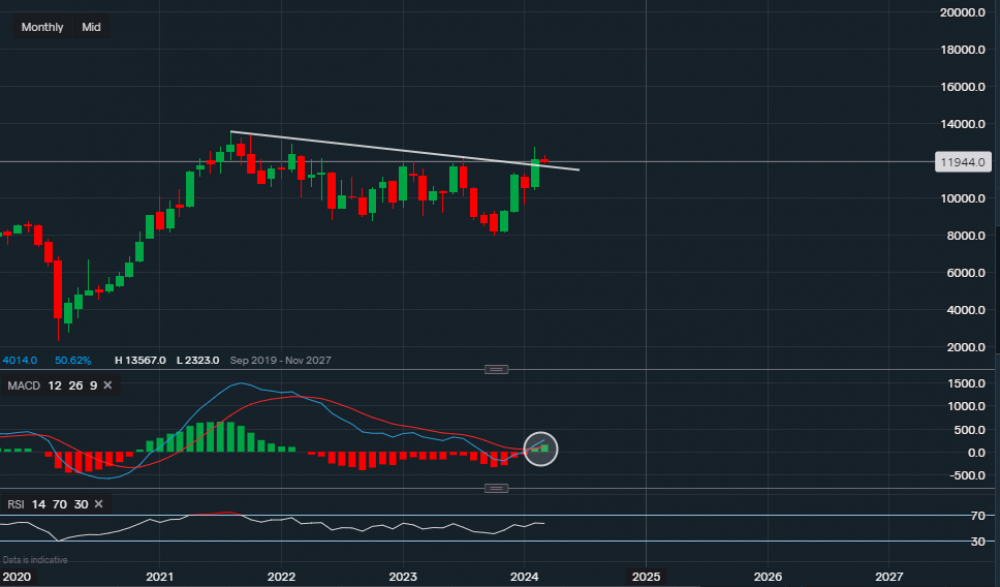
Chart & Data from IG
Taking a look at Discover Financial Services as its stock looks like it could be breaking out here on the monthly chart. Currently, its shares are trading at around $119.44 a share. Looking at the chart, we can see that February’s monthly candlestick closed above the trendline resistance. In theory, this tends to be a bullish indicator, however, markets can be deceiving so caution should remain. Although, positivity seems present. The technical indicators are now shifting towards a bullish bias, the MACD has turned positive as highlighted on the chart. The RSI is also now positive as it reads 57. This indicates a build of momentum, which most likely helped the stock in February in achieving the strong gain. The resistance in focus is now the level of $127.30, which is February’s high. A break and close above this level would then shift the focus towards $130.81 and then $135.67 (an all-time high). The support now sits along the trendline, which is now acting as support rather than resistance. Stocks tend to pull back towards breakout zones before continuing in the direction of a breakout, hence, there is a chance that a short-term pullback towards $117-$118 may happen before a push higher. Although, this is not guaranteed as we could just see a continuation higher. A move below $117-$118 and essentially back below the newly formed support, would suggest that there isn’t enough momentum for a breakout continuation higher. We then may see a period of consolidation where the stock is trying to find a balance due to increased buying and selling.

Tradable assets:
Min.Deposit:
Max Leverage:
FCA:

Rating:


