Test- FTSE 100 Kicks Off August on a High as BP and Senior Lead Market Momentum
$11
10 Oct 2025, 13:13
Neutral
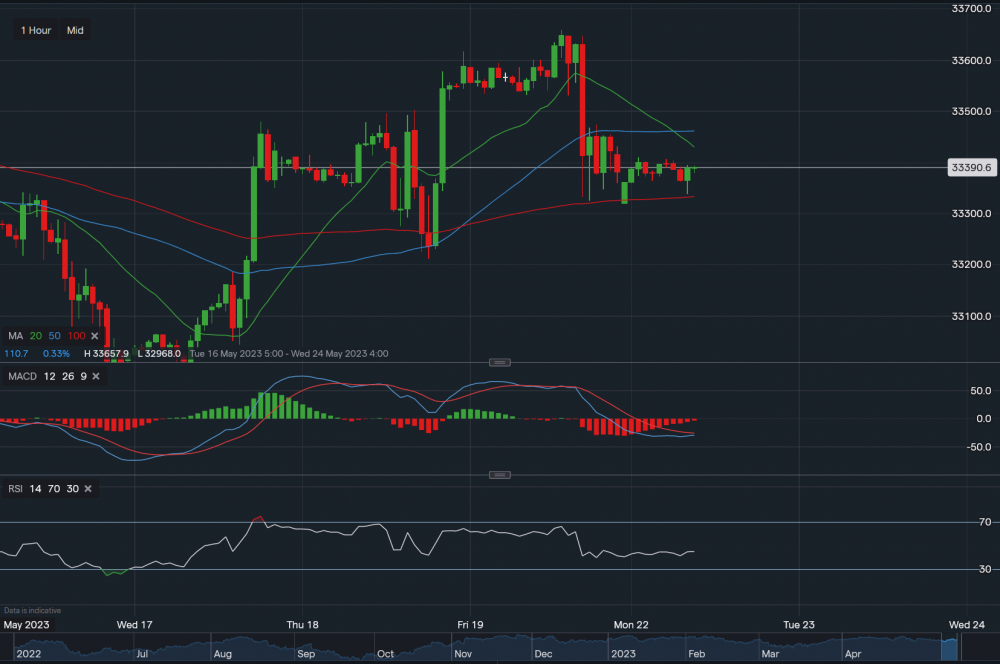
Chart & Data from IG
The Dow Jones retraced again on Friday after climbing higher on Thursday, currently the index is trading at around 33,390. It seems like it has found support along the 100-day moving average on the 1-hour timeframe, with the support sitting at 33,338 followed by 33,320. A break below 33,320 could see the index slide further towards 33,211. On the other hand, towards the upside, resistance sits at 33,429 (20-day MA) and then at 33,461 (50-day MA). A break above the 50-day MA may see the index edge higher towards 33,502 and then even a stretch to 33,578. Looking at the technical indicators, MACD is negative but looks like it could turn neutral-positive, and the RSI is neutral now as it reads 45. But traders should be wary when placing trades as the US debt ceiling discussions go on and there hasn’t been any clear confirmation for the future as of yet.

Tradable assets:
Min.Deposit:
Max Leverage:
FCA:

Rating:


