Test- FTSE 100 Kicks Off August on a High as BP and Senior Lead Market Momentum
$11
10 Oct 2025, 13:13
Neutral
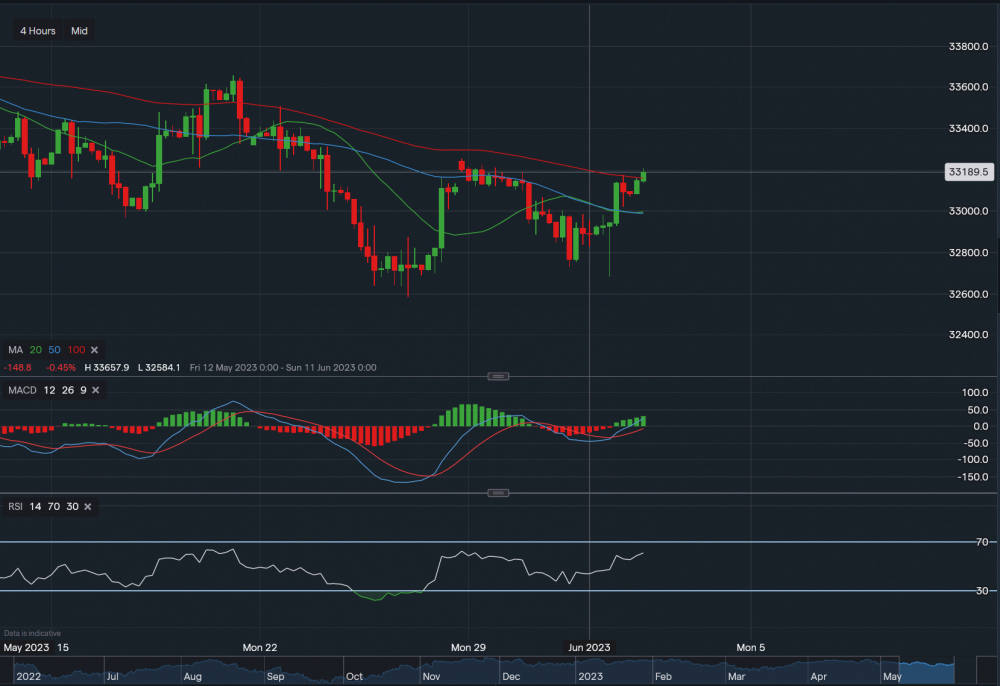
Chart & Data from IG
Taking a look at the Dow Jones after the optimism surrounding the passing of the US debt bill. Currently, the index is trading at around 33,189, we can see that on the 4 hourly timeframe it has now risen above the 100-day moving average. A close above this MA could indicate a move higher, hence, resistance sits at 33,255. A break above this resistance point could see the index head towards the cluster between 33,300-33,350. The previous resistance of 33,159 is now acting as the first line of support, followed by this is 32,996 and 32,989. Or respectively, the 20 and 50-day moving averages. A fall below these levels may see the Dow retrace lower towards 32,750-32,800. Glancing over the indicators, MACD is positive and so is the RSI as it reads 60.

Tradable assets:
Min.Deposit:
Max Leverage:
FCA:

Rating:


