Test- FTSE 100 Kicks Off August on a High as BP and Senior Lead Market Momentum
$11
10 Oct 2025, 13:13
Neutral
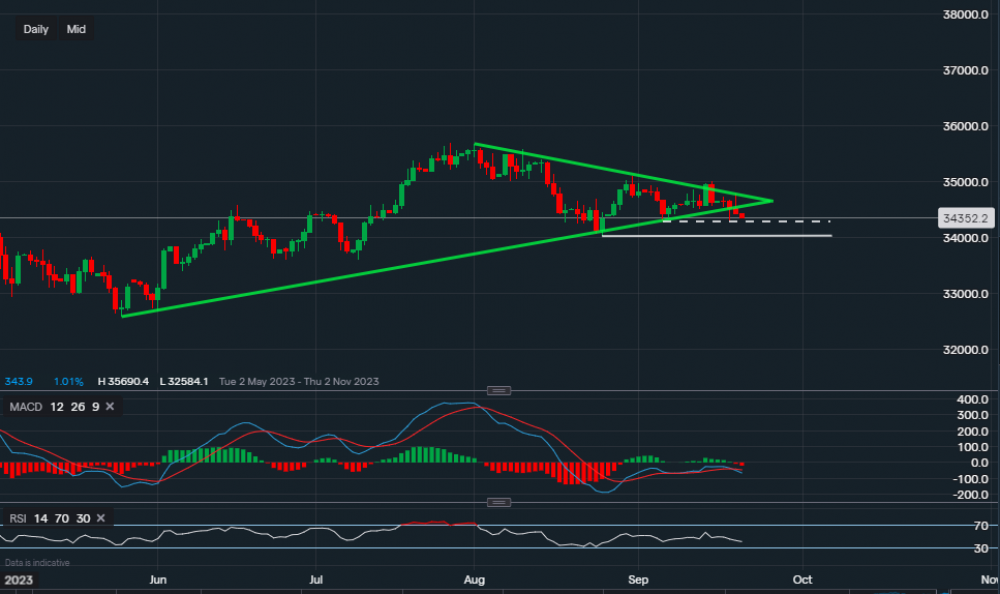
Chart & Data from IG
The Dow Jones index has now broken out of the triangle but towards the downside, this was due to selling pressure after the FOMC meeting yesterday. The Federal Reserve paused its rate hike run but kept its somewhat hawkish future outlook by stating the rates will stay higher for longer instead, which soured some investor sentiment. So we’re taking a look at the index now from a technical perspective, currently, it's trading at around 34,352. As a break towards the downside has occurred, the bias for the short-term has turned negative once again, with support levels now at 34,286 (white dotted trendline) followed by 34,024 (white lower trendline). A break below 34,024 could see the index slide towards 33,609. As the bias is now bearish, it would be unreliable to look at any resistance levels above unless we see consolidation either around the current levels or around the support levels mentioned above. Looking at the technical indicators, MACD has turned negative on the daily timeframe and the RSI falters further as it now reads 41. These momentum indicators support the short-term outlook for the time being.

Tradable assets:
Min.Deposit:
Max Leverage:
FCA:

Rating:


