Test- FTSE 100 Kicks Off August on a High as BP and Senior Lead Market Momentum
$11
10 Oct 2025, 13:13
Neutral
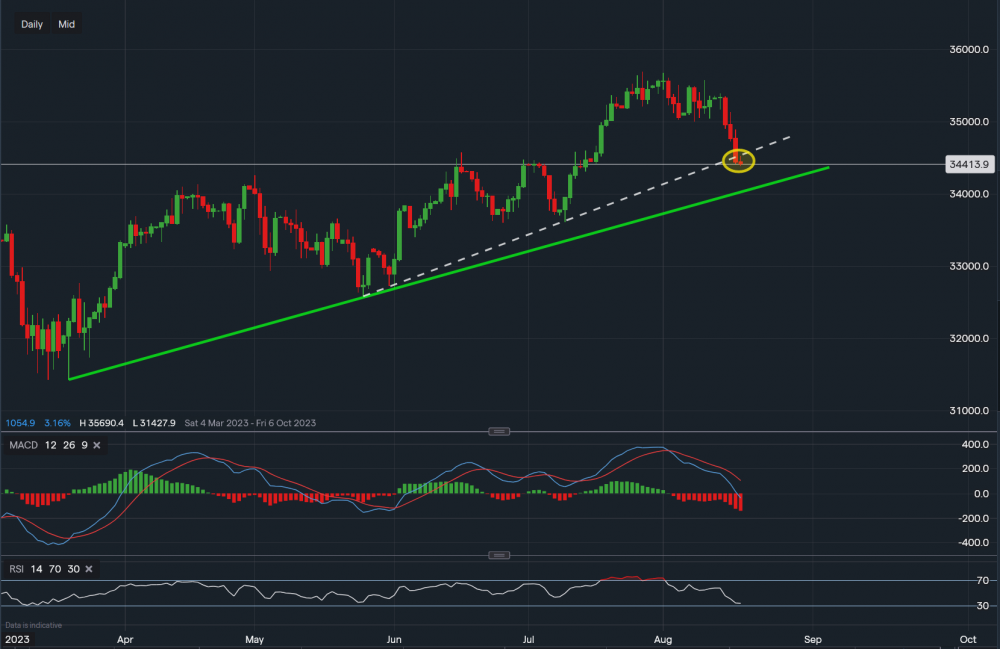
Chart & Data from IG
The Dow Jones has now broken through the first supportive trendline (34,495), highlighted by the orange oval. Currently, the index is trading at around 34,413. The next key level of support is sitting roughly at 34,083 (green trendline) and this support level will be a big test for the index. A break below will not necessarily indicate that another market crash is upcoming as there is further support, but this would have to be analysed at the time of the event. Previous support of 34,495 is now acting as resistance, hence, any consolidation in and around it would then allow us to potentially look again towards any upside levels. Looking at the technical indicators, MACD is still strongly negative on the daily timeframe and the RSI reads 34. However, if we look at the monthly and weekly timeframes, they still show signs of positivity. Therefore at this moment in time, the short-term outlook can see more downside but the longer-term bias remains positive. The charts of the monthly and the weekly can be found below.

Tradable assets:
Min.Deposit:
Max Leverage:
FCA:

Rating:


