Test- FTSE 100 Kicks Off August on a High as BP and Senior Lead Market Momentum
$11
10 Oct 2025, 13:13
Neutral
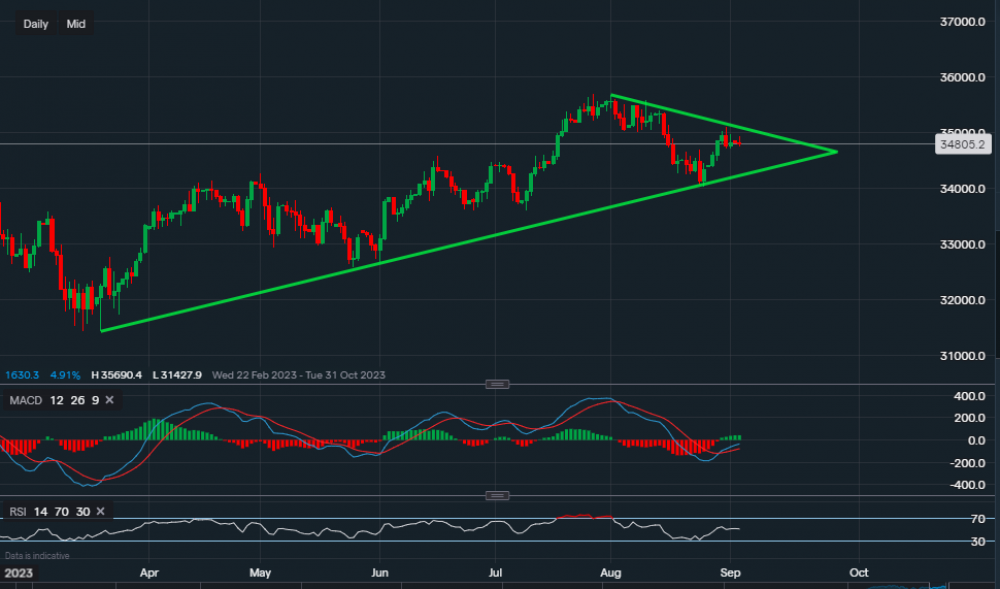
Chart & Data from IG
Taking a look at the Dow Jones as we can see the index had a strong bounce off the ascending trendline, which acted as support, but it has now approached a tough level of resistance. Currently, the index is trading at around 34,805, with the tough resistance sitting at 35,111 (along the trendline). Last Thursday, there was an attempt to push above it but the price of the index only managed to reach 35,099, before falling and closing the session at 34,716. We can see the momentum has slowed since then as the Friday session was weak and today was a holiday in the US. Support now sits at 34,716, a break below this point could see the Dow move lower towards 34,493. A move above 35,000 would only then prompt us to look towards the upside. However, if we look at the technical indicators, they continue to demonstrate a neutral-positive outlook. The MACD is still positive and the volume has lowered as of yet, and the RSI is neutral as it reads 51.

Tradable assets:
Min.Deposit:
Max Leverage:
FCA:

Rating:


