Test- FTSE 100 Kicks Off August on a High as BP and Senior Lead Market Momentum
$11
10 Oct 2025, 13:13
Neutral
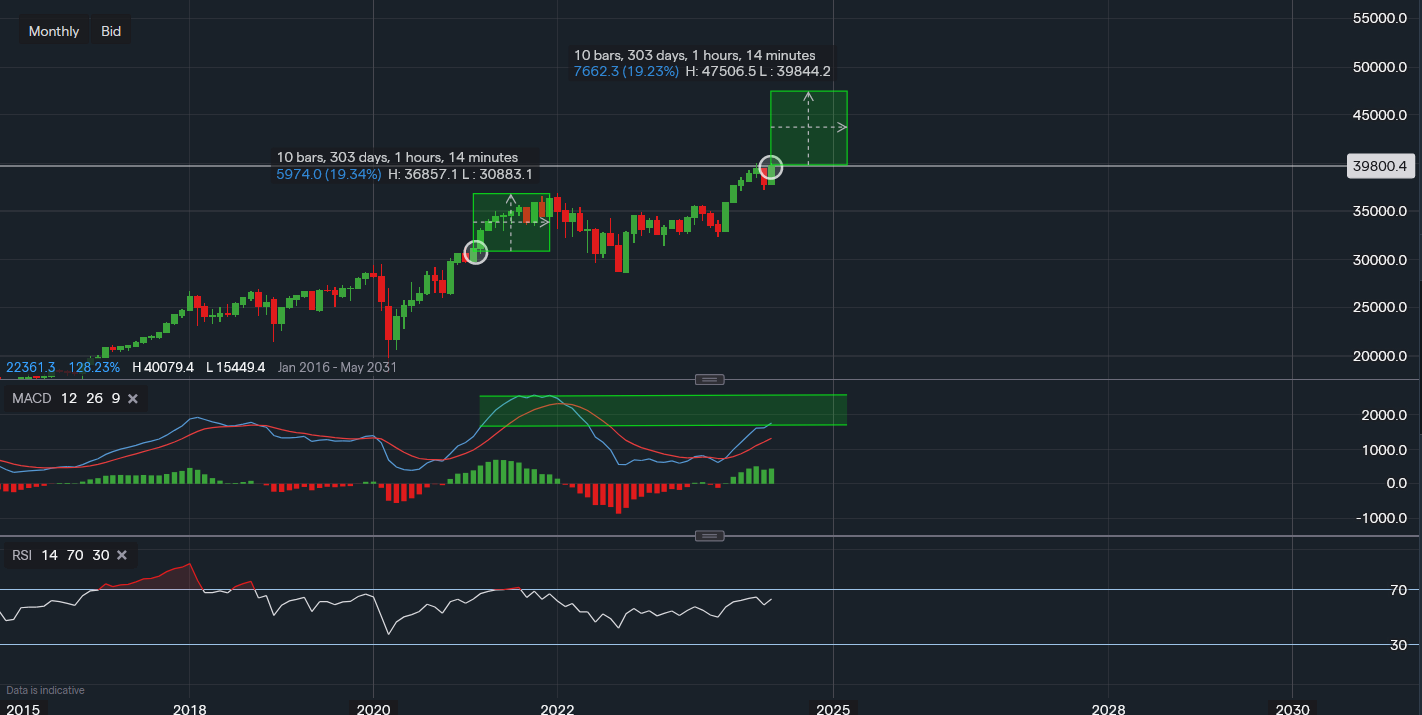
Chart & Data from IG
The Dow Jones index is currently trading at around 39,800 after hitting the 40,000 mark earlier in the week. We have analysed the history of the chart to determine any correlation patterns. By looking at the monthly interval, we can see that when the index reached the 30,000 mark, it then returned 19.3% over the course of the following 10 months. This gain resulted in an approximate move from 30,000 to 36,600. If history was to repeat itself, a 19.3% move from 40,000 would see the index rise to approximately 47,500. Looking at the technical indicators, they do seem to be positioned well for potentially more upside in the short-medium term at least. The MACD isn’t overbought as of yet and still has room to grind higher, as highlighted by the green channel. The RSI is also positive and back on the rise again after the April sell-off, reading 63.
However, the above information is simply based on the technical history of the chart and many factors can influence the future volatility and returns of the DJIA. Some include geopolitical risks, global elections, inflation, and the overall US economy. The above is a plain observation and should not be used as financial advice by any means.

Tradable assets:
Min.Deposit:
Max Leverage:
FCA:

Rating:


