Test- FTSE 100 Kicks Off August on a High as BP and Senior Lead Market Momentum
$11
10 Oct 2025, 13:13
Neutral
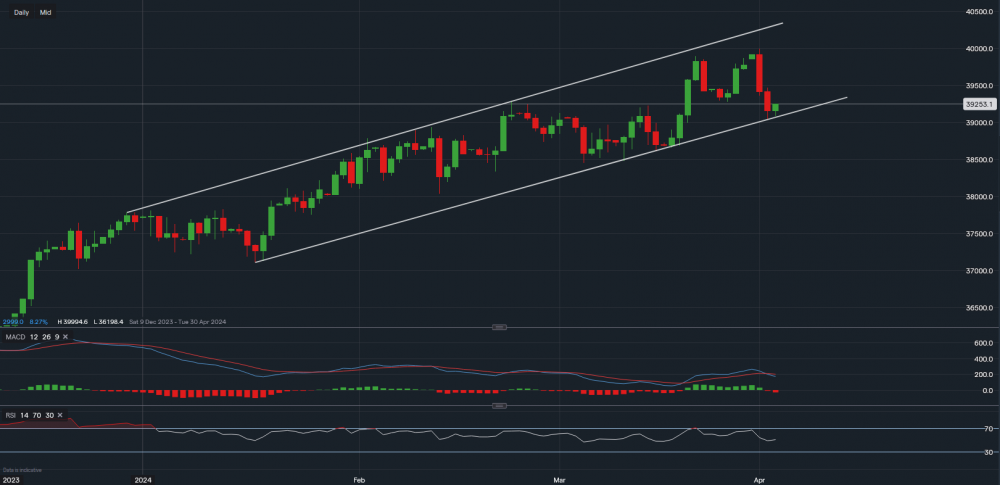
Chart & Data from IG
The Dow Jones continues to trade within the channel drawn on the daily chart. Currently, the American index is trading at around 39,253. We can see that support is provided by the lower trendline with the support level reading 49,064. The index came close to testing this level in the pre-market session. However, there is also support at 39,047, hence, only a move below this level could see the index decline further. In that case, the next support level that would become the main focus would be the area of 38,600-38,700. Towards the upside, if the index manages to remain above the trendline, we may see it creep up higher. The resistance for the near term sits at 39,287 and then at 39,474. A break and close above this level would certainly allow the bulls to look towards the all-time highs once again. Looking at the technical indicators, we can see that the MACD has now turned negative, creating some concern for the near term. Additionally, the RSI has now moved into a neutral stance as it reads 50.

Tradable assets:
Min.Deposit:
Max Leverage:
FCA:

Rating:


