Test- FTSE 100 Kicks Off August on a High as BP and Senior Lead Market Momentum
$11
10 Oct 2025, 13:13
Neutral
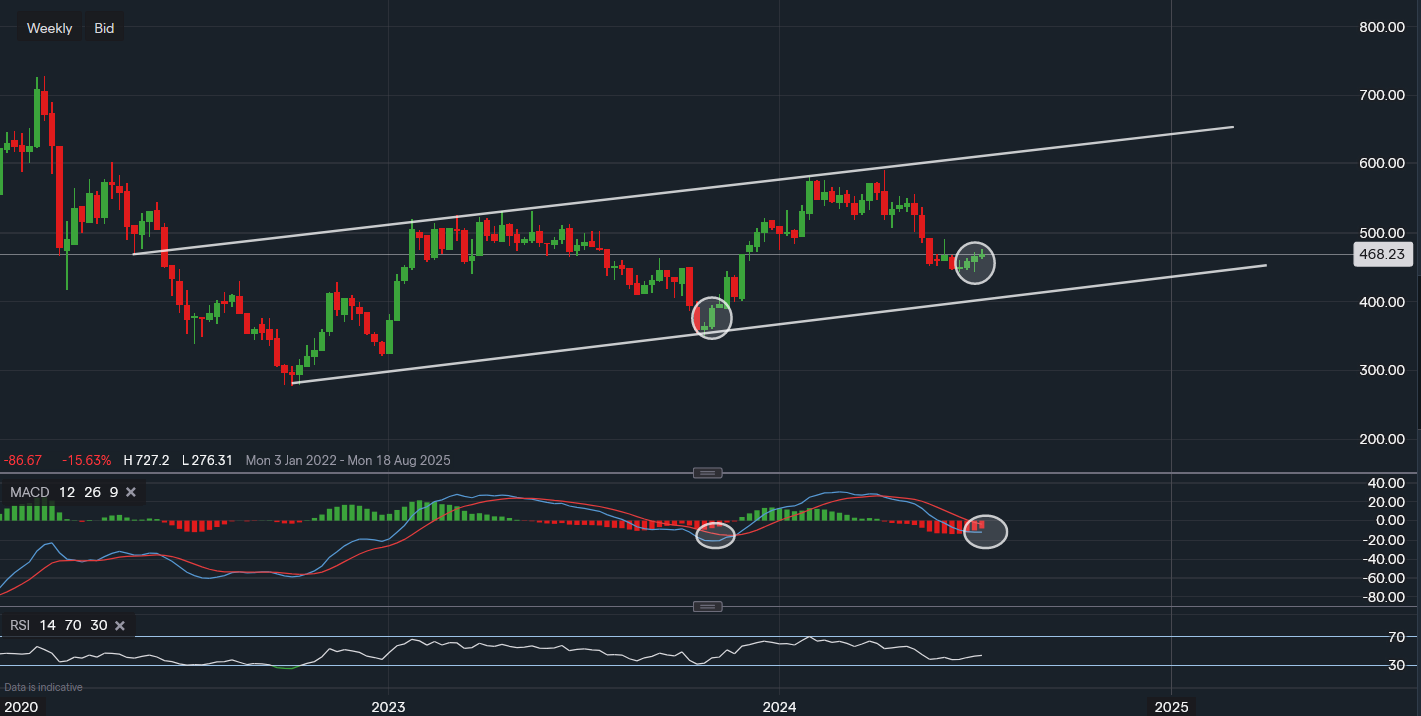
Chart & Data from IG
Taking a look at easyJet on the weekly interval as the stock is showing signs of early consolidation before possibly another leg higher. Currently, the airline’s stock is trading at around 468p a share after selling off following a rally towards 600p a share. The last time easyJet’s share price was trading at around 600p a share was back in April of 2022. Looking at the chart, we can see that for now, the price is forming a pattern of higher highs followed by higher lows. Signs of possible consolidation are now present, increasing the likelihood of another leg higher toward the upper trendline of the channel. This rally could potentially lead to a break above 600p for the first time in over two years. However, there are resistance levels along the way with the first one sitting at 490p. A break above this level could then see the bulls look towards 521p and then 530p. Caution should remain as even though signs of consolidation are present, the price hasn’t tested the lower trendline support. It’s not always guaranteed that a decline all the way to the trendline is likely, but this is why caution should remain as on other occasions it can. The positioning of the technical indicators is what may catch the attention of traders/investors here. The MACD seems like it may be bottoming out as it did back in October and the RSI is now starting to move higher once again, reading 44 and almost in neutral. The RSI is also hinting a possible bullish divergence as it didn’t move below the reading of 38, even though the price made a lower low (note: this divergence signal can be the weakest compared to the rest).

Tradable assets:
Min.Deposit:
Max Leverage:
FCA:

Rating:


