Test- FTSE 100 Kicks Off August on a High as BP and Senior Lead Market Momentum
$11
10 Oct 2025, 13:13
Neutral
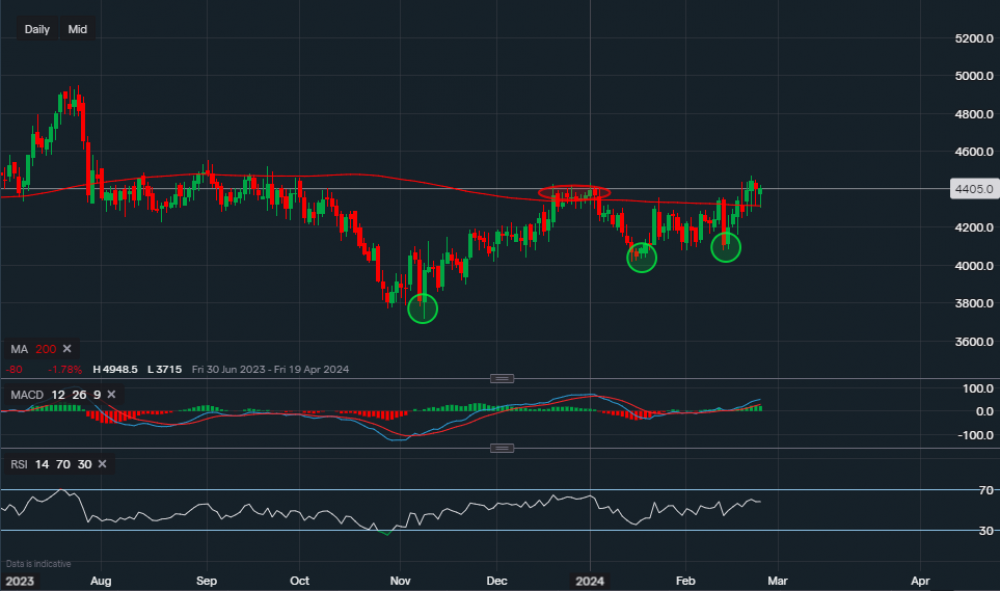
Chart & Data from IG
Taking a look at eBay as its share price has moved and closed above its 200-day moving average on the daily chart. Currently, its shares are trading at around $44.05 a share, with a potential set-up for a push higher. Looking at the chart, we can see that the major support was established at $37.15 (green oval on the left-hand side, back in November. The other key support area is located between $40.16-$40.74 (green ovals on the right-hand side). The reason for this key support area establishment is that between the 13th and 14th of February, the price pulled back for a re-test of support, which managed to uphold itself. Therefore, a build of bullish momentum now is present. However, eBay is due to report earnings tomorrow, which could easily shift the recent momentum bias. Nevertheless, resistance is at $44.34, we can see the stock has struggled to overcome this resistance so far with an attempt to move higher last week. A break above this resistance would allow the bulls to look towards $45.53 and then $46-$47. There is some support along the 200MA currently reading $43.12, only a break and close below the 200MA could result in a further slide back towards the key support area of $40.16-$40.74. Based on the technical indicators, they portray a bullish bias. The MACD is positive and rising and the RSI is just positive as it reads 57. eBay is expected to report an EPS of $1.03 on revenue of $2.51bn.

Tradable assets:
Min.Deposit:
Max Leverage:
FCA:

Rating:


