Test- FTSE 100 Kicks Off August on a High as BP and Senior Lead Market Momentum
$11
10 Oct 2025, 13:13
Neutral
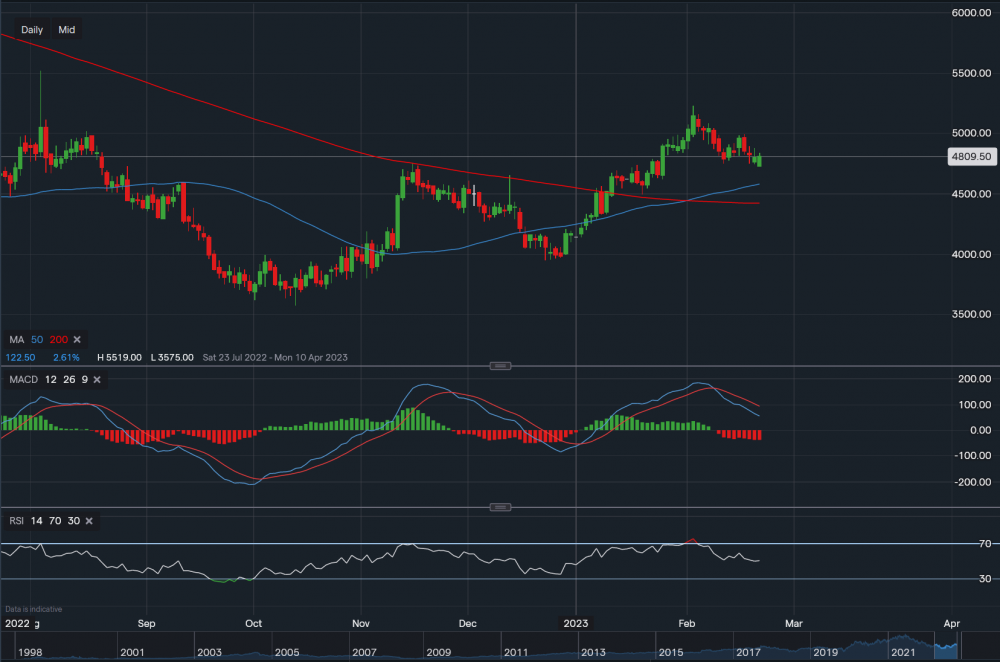
eBay - Chart & Data IG
eBay’s shares are currently trading at around $48.09 per share. On the daily timeframe, we can see that the 50-day moving average has crossed above the 200-day moving average. This is often called a ‘golden cross’, which can sometimes suggest that a bullish trend is forming. Although, this is not always an accurate method and should not be used alone when investing. Nevertheless, the resistance above is located at $48.80 and then at $49.93. A break above $49.93 could see the price climb towards the next important level at $52.29. On the other hand, eBay is expected to release some earnings after the US market closes. A negative report may wobble its stock, hence, support sits at $48.38 then at $45.79 (corresponds with the 50-MA) then at $44.22 (200-MA). A break below the 200-MA may result in a continuation of this bearish trend as seen in 2022. The technical indicators are mixed, MACD is negative but RSI is neutral as it reads 50. eBay is expected to release quarterly earnings of $1.06 on revenue of $2.46bn.

Tradable assets:
Min.Deposit:
Max Leverage:
FCA:

Rating:


