Test- FTSE 100 Kicks Off August on a High as BP and Senior Lead Market Momentum
$11
10 Oct 2025, 13:13
Neutral
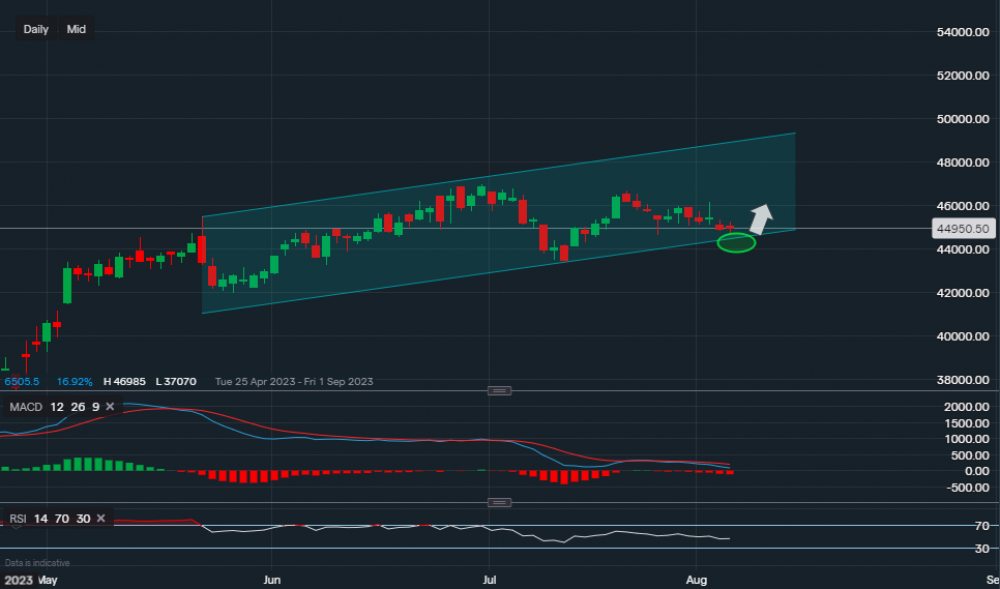
Chart & Data from IG
Eli Lilly currently trading at around $449.50 a share. We can see the price hasn’t really made any significant moves from the highs achieved in May, it has been gently rallying within the channel drawn on the chart. It is now approaching a key support level sitting at $444.86, this is highlighted by the green oval. The longer-term bias for this stock remains bullish, however, a break below this support level could see short-term downfalls. In this case, we would then look at support sitting at $434.36 followed by $419.93. On the other hand, a strong earnings report may see a bounce off the lower trendline of the channel, as pointed out by the arrow. The resistance can be found at $459.53 then at $461.64 and then at $467.05. A move above $467.05 could see a rise back up towards the upper trendline of the channel. Looking at the indicators, MACD is slightly negative and the RSI is neutral as it reads 46.


