Test- FTSE 100 Kicks Off August on a High as BP and Senior Lead Market Momentum
$11
10 Oct 2025, 13:13
Neutral
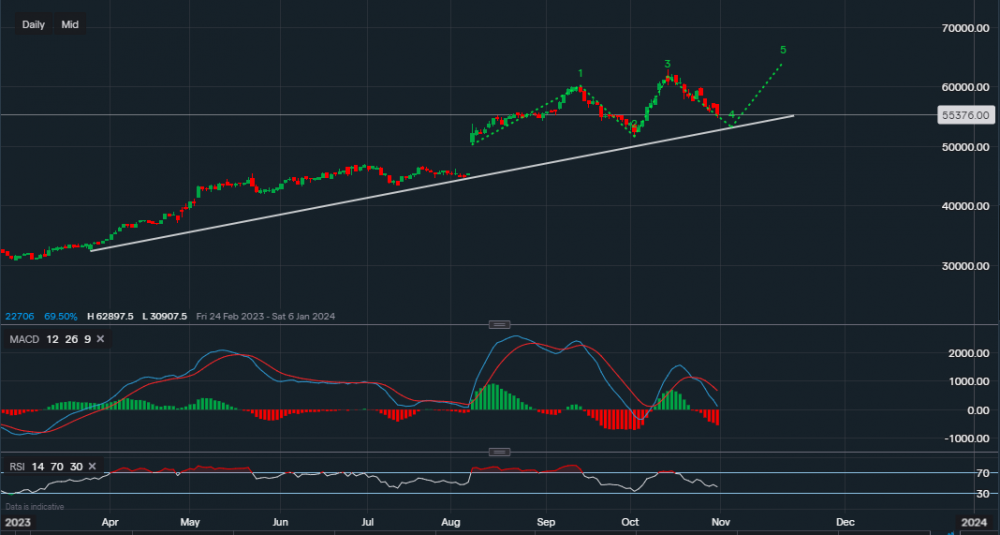
Chart & Data from IG
Eli Lilly seems like it is continuing with its bullish trend, creating a higher high in mid-October and now retracing back to the trendline once again. Currently, its stock is trading at around $553.76 a share. We can see that since August it has been following a pattern of higher highs and higher lows, with the price now undergoing what seems like a higher low. There is still room for more downside as the trendline support reads $530.94. A break below would not necessarily suggest that the outlook of the stock has shifted to ‘sell’, as the more important support level sits at $516.68. The company is due to report its earnings tomorrow, a positive report could be the start of the next leg higher which is drawn on the chart (4 to 5). However, this is not guaranteed as the Q3 earnings season has been a hit-and-miss, hence, a negative report may weigh on the stock. Looking at the technical indicators, both are negative with the RSI reading 42. But as seen in the past, the price has created higher lows leading to higher highs. This is not always recognised by the indicators as they tend to lag.

Tradable assets:
Min.Deposit:
Max Leverage:
FCA:

Rating:


