Test- FTSE 100 Kicks Off August on a High as BP and Senior Lead Market Momentum
$11
10 Oct 2025, 13:13
Neutral
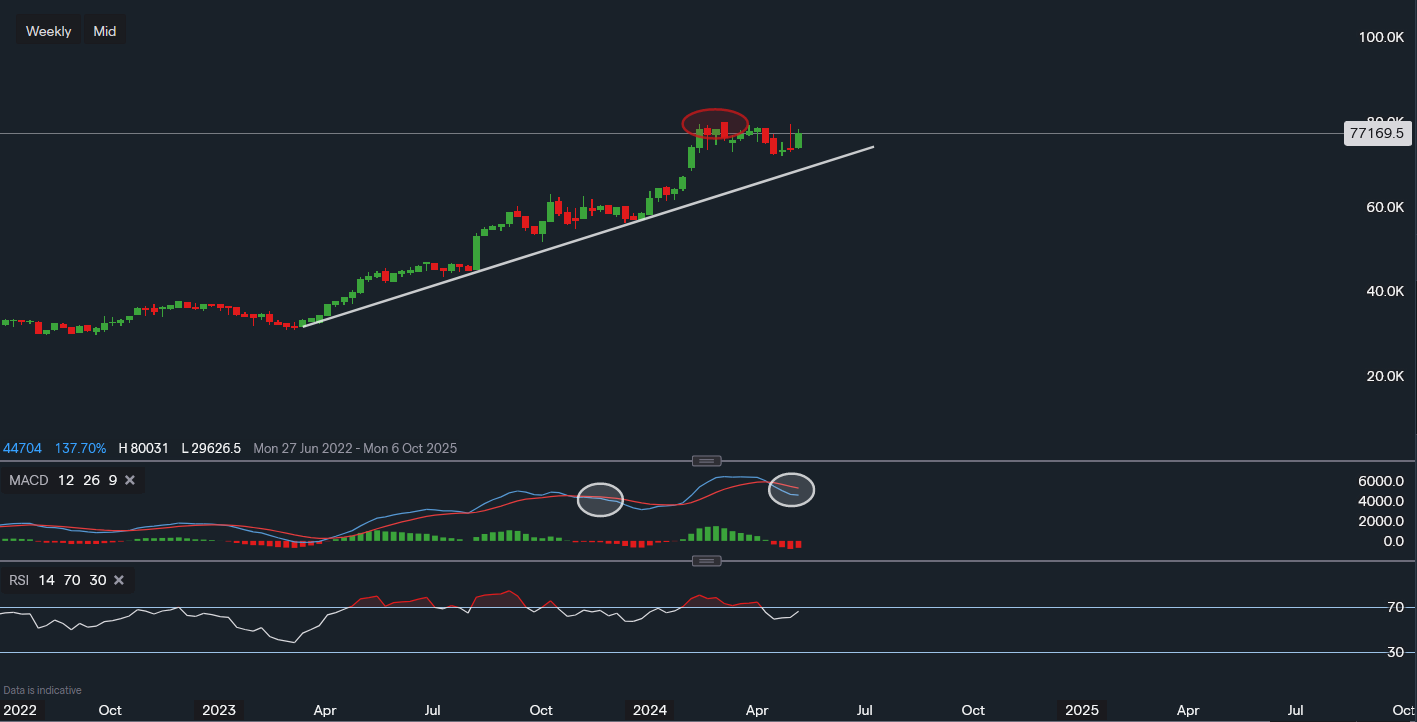
Chart & Data from IG
Eli Lilly looks like it has been taking a breather in recent weeks following some impressive gains. Currently, its stock closed yesterday’s trading session at $771.69 a share. Looking at the weekly chart, we can see a clearly established supportive trendline that dates back to March of 2023. For the time being, the primary resistance here is the all-time high of $800.31 (red oval). A break above this level makes it more difficult to anticipate any price movements as there are no resistance points above, hence the price is more prone to fluctuations based on news sentiment or catalysts. Support below sits at $718.30, a move below would most likely result in a pullback towards the supportive trendline as part of a healthy minor correction. The support along the trendline currently reads $690.20. Only a dip below the trendline could lead to further downside pressure. Looking at the technical indicators, the MACD has turned negative. But as seen in the past, when its done before it was short lived by some side movements before a continuation higher. It is not guaranteed that this will be the case, but a useful strategy to determine future price changes is to look at the history of the stock and its habits. Whereas the RSI is still positive and rising as it reads 65. The two indicators are actually counteracting each other, in other words, creating mixed signals for investors.

Tradable assets:
Min.Deposit:
Max Leverage:
FCA:

Rating:


