Test- FTSE 100 Kicks Off August on a High as BP and Senior Lead Market Momentum
$11
10 Oct 2025, 13:13
Neutral
Eli Lilly - Chart & Data from IG
Overview
With operations throughout 18 nations, Eli Lilly is an American pharmaceutical company with its main headquarters in Indianapolis, Indiana. Approximately 125 nations sell its products. The business was established in 1876 and is named after Colonel Eli Lilly, a pharmacist and American Civil War soldier.
Financials
Taking a look at the drug maker’s income statement, for the fiscal year 2022, the revenue has grown marginally with gross profit rising $0.9bn. Net income after tax and expenses came in at $6.2bn, a $0.7bn increase year-on-year. This was due to an efficient reduction in the costs of goods sold, creating a more profitable margin. At present, Eli Lilly is operating at a 76% profit margin. Asa result of the above, earnings per share grew 12% to $6.90 for the year. Over to the balance sheet, cash on hand is moderately strong and has risen $0.3bn, contributing to the $2bn growth in total assets. Whereas total liabilities actually declined by over $1bn. Hence, the company managed to grow its equity by 57% YoY, as it’s heading towards the higher levels seen between 2014-2016.
Financials
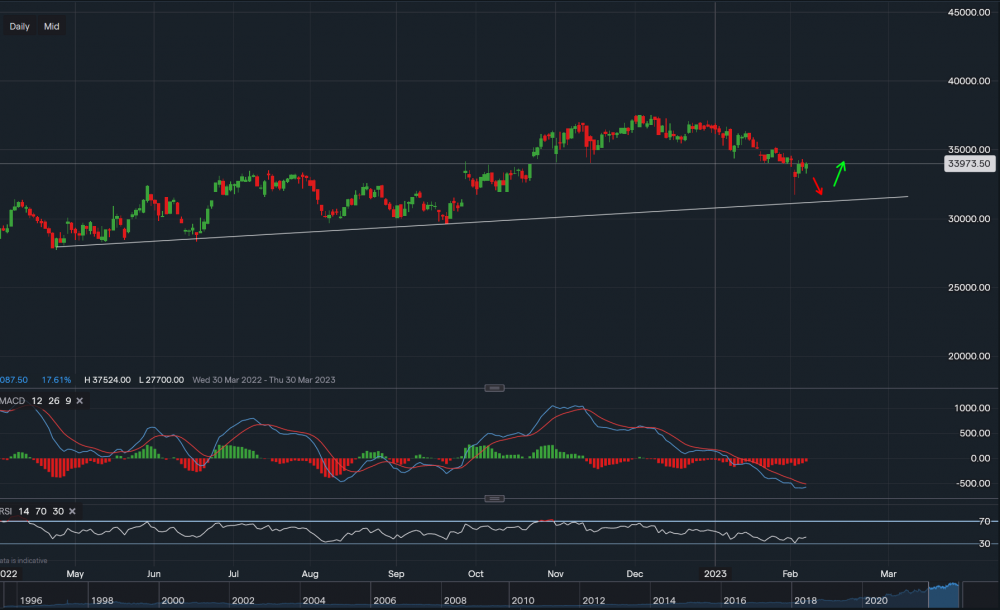
From a technical viewpoint, the stock’s share price is sitting around $339.73 a share. We can see an established support base along the trendline which has proven to hold since April last year. Support currently sits at $317.15 then at roughly $312.29 (along the trendline). A break below the trendline could see the price decline to the range of $290-$295, and a break below that range may result in a reversal trend due to potentially higher sell-off pressure. On the other hand, as the long-term bias remains bullish, resistance sits at $343.35 then at $352.10 then at $365.25. A close above $365.25 could see the price jump back to the high of $374. Looking at the technical indicators, MACD is negative but seems like it’s swaying towards a neutral position. And so is RSI as it read 41.
Summary
Based on the financials of the company, it continues strongly after the boost from the Covid pandemic. As shown above, steady growth is visible and the ratio of assets to liabilities is well-balanced. EBITDA did fall slightly but still remains within the same boundary as during and after the pandemic, still substantially higher than in years prior to Covid. The technicals currently suggest further short-term downside, although the bias is still bullish in the longer term. There is potential for a move lower before bouncing higher if we look at the trend since April 2022. Nevertheless, support is sat firmly below and at the moment only heavy sell-offs would see the gains fade away. Some may argue that this stock is overvalued due to lowering demands for Covid vaccines, but it is very much still on the positive side.

Tradable assets:
Min.Deposit:
Max Leverage:
FCA:

Rating:


