Test- FTSE 100 Kicks Off August on a High as BP and Senior Lead Market Momentum
$11
10 Oct 2025, 13:13
Neutral
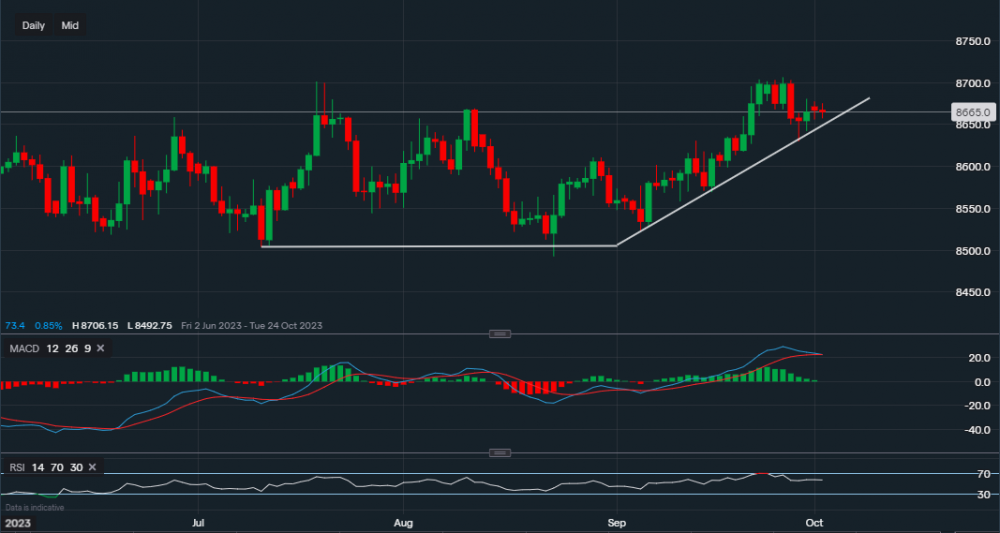
Chart & Data from IG
The euro is currently trading at around €0.8664 against the pound, we can see that a base was formed at €0.8504 (horizontal trendline) on July 11th, which was re-tested on the 23rd of August. Since the 23rd of August, the euro has risen against the pound reaching €0.8706. This level was a resistance level that the forex pair has struggled to overcome, as a result, it is undergoing a retracement. The first support level sits along the ascending trendline at €0.8657 and then followed by €0.8629. A break below €0.8629 may suggest that the pair could slide lower, potentially back down towards €0.8600. Towards the upside, if support manages to uphold, resistance now sits at €0.8669 followed by the key resistance of €0.8706. A move above €0.8706 could see an extension towards €0.8720. If we look over at the technical indicators, they are very mixed at this moment in time. The MACD seems like it is on the verge of turning negative whereas the RSI is still positive as it reads 55.

Tradable assets:
Min.Deposit:
Max Leverage:
FCA:

Rating:


