Test- FTSE 100 Kicks Off August on a High as BP and Senior Lead Market Momentum
$11
10 Oct 2025, 13:13
Neutral
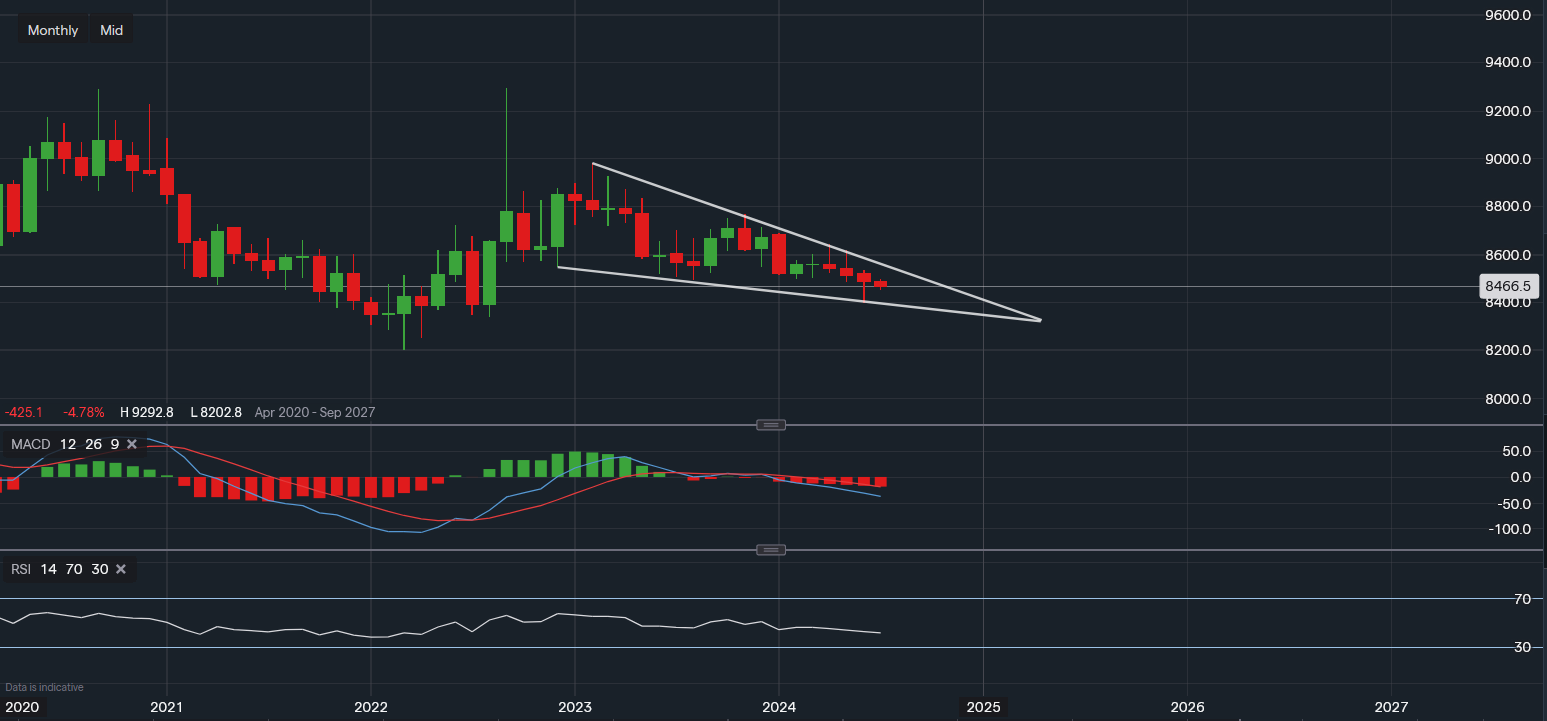
Chart & Data from IG
Taking a look at the EUR/GBP as the pair is trading in a flat range as the UK elections take place. Currently, the euro is trading at around €0.8466 against the pound. Looking at the monthly chart, we can see a potential falling wedge formation, which usually suggests that selling momentum is starting to fade. However, with the elections underway it is yet unclear what effect this will have on sterling, A positive impact could lead to a break out of this wedge to the upside, with resistance for July reading €0.8555. However, a move above the April high of €0.8644 would be needed to confirm the trend reversal. Towards the downside, the support in focus is last month’s low of €0.8397. A break below this level would likely cause a fall towards the summer lows of 2022. The technical indicators certainly favour the bears as the MACD is relatively negative and the RSI is gradually slipping as it reads 42.

Tradable assets:
Min.Deposit:
Max Leverage:
FCA:

Rating:


