Test- FTSE 100 Kicks Off August on a High as BP and Senior Lead Market Momentum
$11
10 Oct 2025, 13:13
Neutral
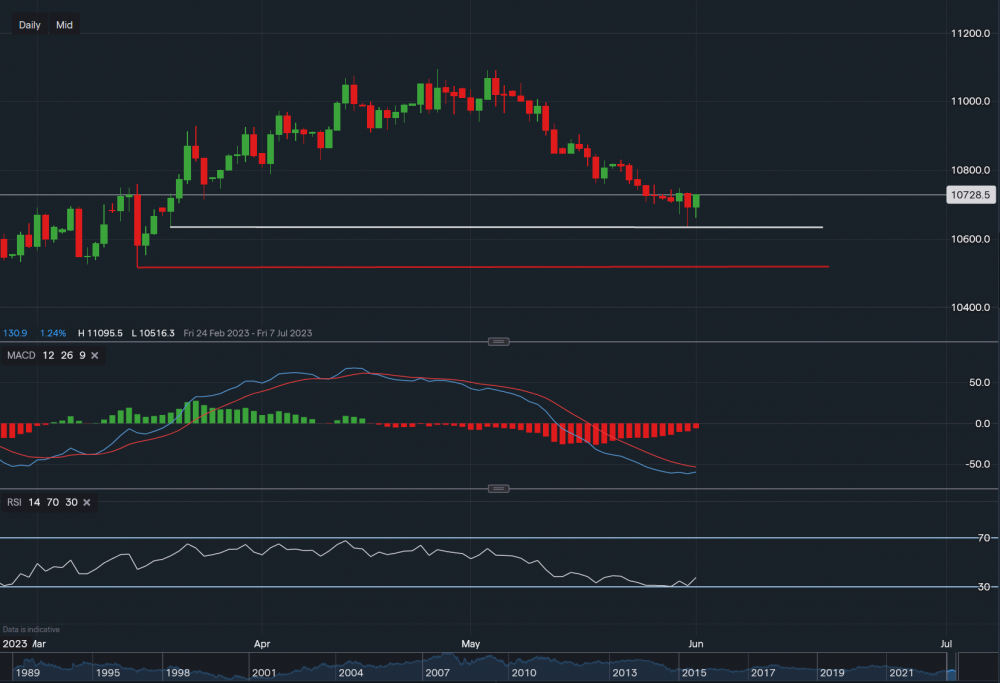
Chart & Data from IG
EUR/USD seems like it is trying to form a base on the daily timeframe, after almost testing the support level of €1.0631 (white trendline). Currently, the euro is trading at around €1.0728 versus the dollar. We can see the support still remains at €1.0631, a break below this price could see the forex pair slide lower towards the next major support sitting at €1.0516 (red trendline). As the forex pair has been in a bearish trend since the 4th of May, and there are signs of consolidation, there may be potential for some upside. Hence, resistance sits at €1.0746 then at €1.0831 and finally at €1.0904. A move above €1.0904 could see a push back up towards €1.1000 seen in April. Looking at the indicators, MACD is negative but curving towards a neutral stance and the RSI has bounced out of ‘oversold’ territory. Now reading 38, still negative but heading towards a neutral position.

Tradable assets:
Min.Deposit:
Max Leverage:
FCA:

Rating:


