Test- FTSE 100 Kicks Off August on a High as BP and Senior Lead Market Momentum
$11
10 Oct 2025, 13:13
Neutral
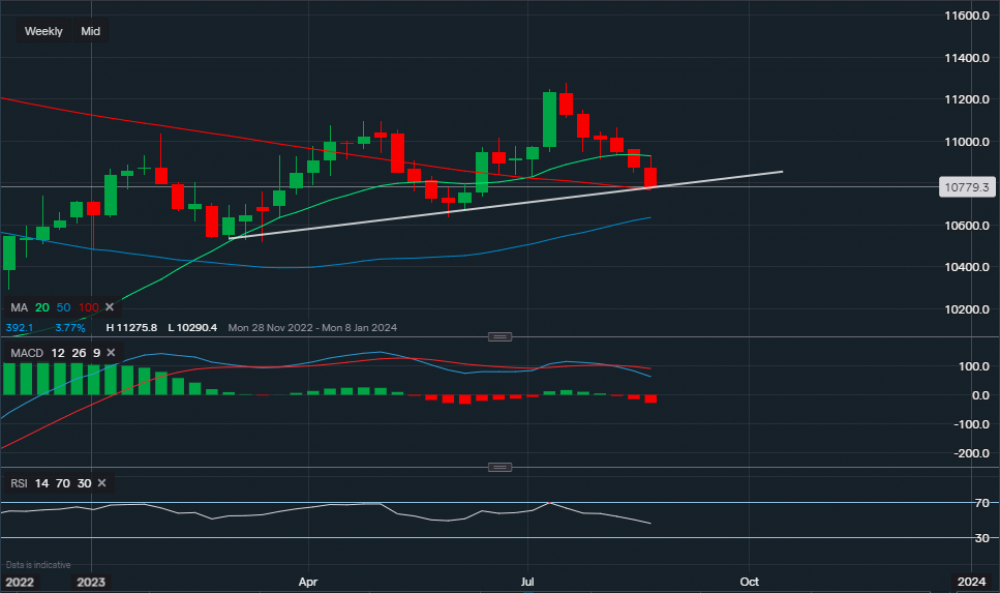
Chart & Data from IG
Taking a look at EUR/USD as it has just reached a key support level of €1.0766. This level corresponds with the 100-day moving average and the supportive trendline, hence, any consolidation around it may see a short-term bounce higher. Currently, the forex pair is trading at around €1.0779. Based on the weekly timeframe (Figure 1), we can see that the bias is still negative as we have seen a big sell-off since the week commencing July 17th. The MACD technical indicators have also now turned negative with a rising volume. However, the forex pair has now been falling for 6 consecutive weeks and when this has happened in the past, there has been a bounce higher. Of course, this is not guaranteed.
But let’s take a look at a smaller timeframe, on the 4-hourly interval (Figure 2) we can see the price is already trying to find some support as it has edged a little higher since creating this analysis post. On the 4-hourly the euro is now trading at €1.0787 against the dollar. Applying the Bollinger Bands, we can see that it is currently sat in the lower Bollinger, with the outlined key support along the trendline at €1.0766. A break below this level may indicate that the bearish trend is set to continue. However, due to the heavy sell-off, Minipip thinks that a move towards the upside may now be upcoming based on the history of the chart shown above. The key resistance of this move can be found along the middle moving average of the Bollinger’s, currently reading €1.0841. A break above this level could see a push towards €1.0876 and potentially even the upper Bollinger, which reads €1.0912. However, this would only be more likely if a clear move above the MA occurred. Finally, the RSI indicator hit a 30 reading on the previous candlestick, suggesting almost oversold conditions. This can also be an indication that a short-term reversal trend could occur.
Figure 1

Figure 2


Tradable assets:
Min.Deposit:
Max Leverage:
FCA:

Rating:


