Test- FTSE 100 Kicks Off August on a High as BP and Senior Lead Market Momentum
$11
10 Oct 2025, 13:13
Neutral
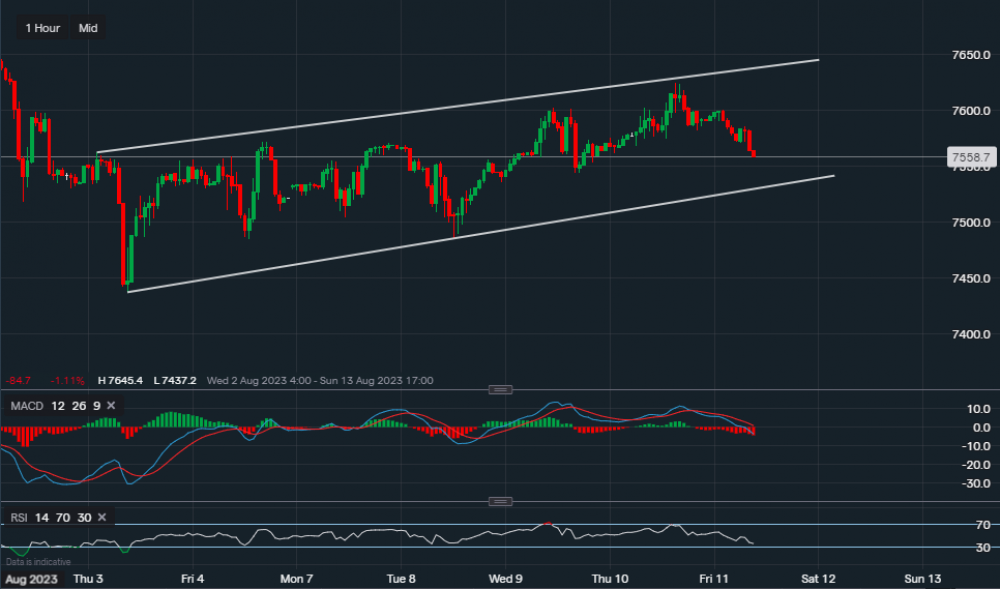
Chart & Data from IG
FTSE 100 has been rallying over the last few days, currently trading at around 7,558. The UK GDP data released earlier this morning showed that the economy grew marginally, and even though that is a positive, it may still not be enough to keep the index afloat. Based on recent news, the Bank of England seems like it may continue with its interest rate hikes. This in theory would strengthen the pound but in turn weaken the FTSE. Of course, this is not guaranteed. However, let’s look at the potential support and resistance levels. Support now sits at 7,544 followed by is 7,535. A break below 7,535 could see the index slide lower towards trendline support of 7,530. As we can see on the 1 hourly timeframe, the index has been rallying within the channel drawn on the chart. Therefore, we may see a bounce off the trendline before a potential continuation lower. A bounce off the trendline may see a rise towards 7,550-7,560, if that was the case, further analysis would be required to assess the situation at the time. Looking at the technical indicators, MACD is negative and so is the RSI as it reads 32.

Tradable assets:
Min.Deposit:
Max Leverage:
FCA:

Rating:


