Test- FTSE 100 Kicks Off August on a High as BP and Senior Lead Market Momentum
$11
10 Oct 2025, 13:13
Neutral
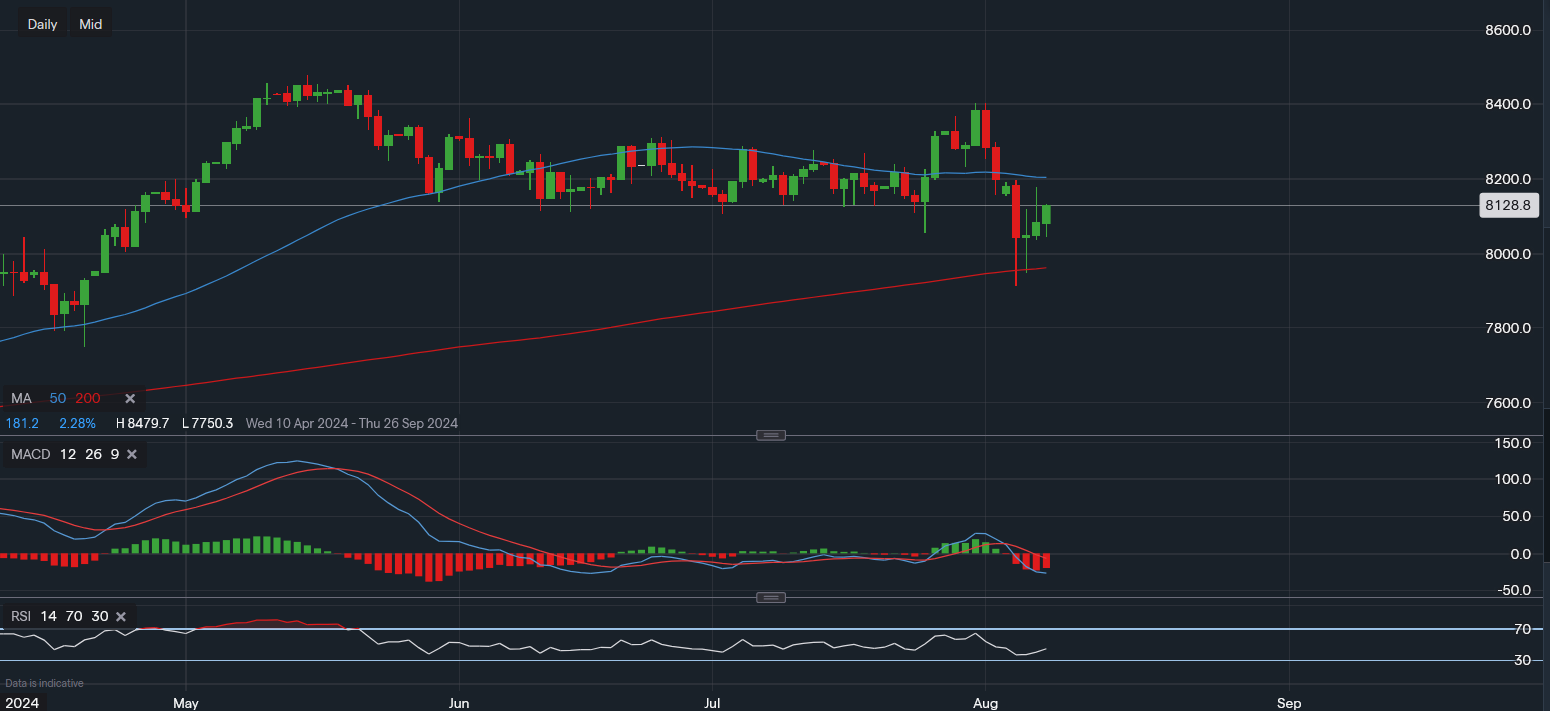
Chart & Data from IG
The FTSE100 continues on the slippy slope and is now only up 5% YTD as it's dragged down by the concerns over in the US. Currently, the index is trading at around 8,128 after reaching an all-time high of 8,479 back in May. After an attempted move higher, the index found resistance around 8,400 leading to a sell-off towards the 200-day moving average. The 200MA is currently reading 7,962, which should offer support in the near term. A break below it could spur a deeper sell-off towards the next level of support around 7,750. Towards the upside, a move back above the 50MA may reignite some confidence amongst investors, potentially de-risking any downside volatility. The 50MA is currently reading 8,204. A break above it would then shift traders’ focus towards 8,313 and then 8,404. Technical indicators portray a mixed outlook for the near term as the MACD is negative but the RSI has now climbed into neutral territory.

Tradable assets:
Min.Deposit:
Max Leverage:
FCA:

Rating:


