Test- FTSE 100 Kicks Off August on a High as BP and Senior Lead Market Momentum
$11
10 Oct 2025, 13:13
Neutral
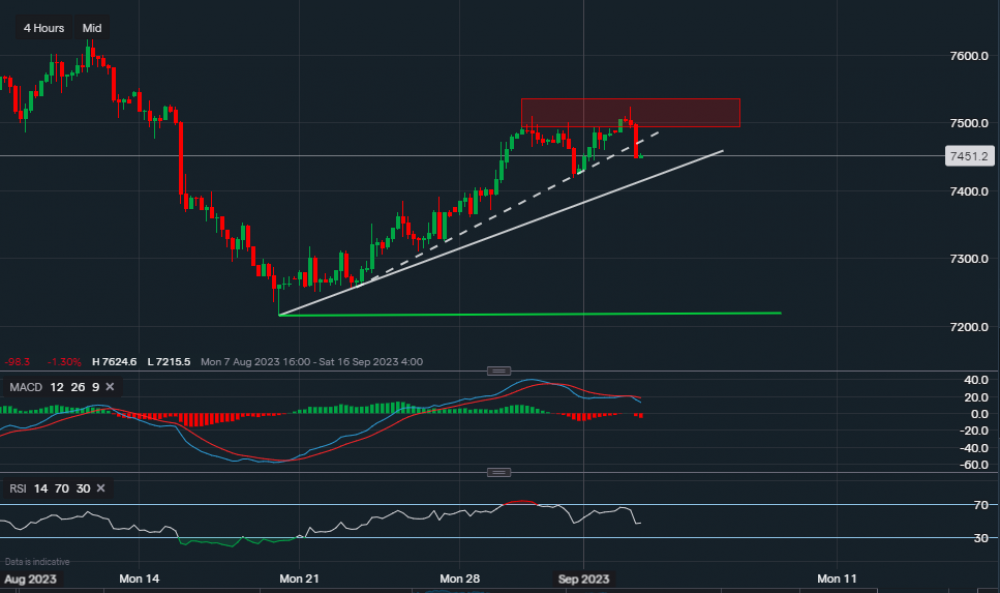
Chart & Data from IG
Taking a look at the FTSE 100 as the index has broken through the first trendline support, currently trading at around 7,451. The trendline support on the 4-hourly timeframe was sitting at 7,468 (dotted), and the next level of support sits along the lower white trendline at 7,419. A break below 7,419 could suggest that a reversal trend is starting to form, and we may see the index slide lower towards 7,340-7,360. The base support sits along the green trendline at 7,215.
The short-term bias has now turned negative, so it would be unreliable to look at the resistance level above unless we see consolidation along the lower white trendline or above 7,419. Looking at the technical indicators, MACD is negative with the RSI now turning neutral as it reads 47. Looking at the history of the chart, momentum seems to be slowing once again with shorts occurring more often, and we can see that the resistance within the red zone (marked on the chart) is overpowering for the moment. When similar signs have appeared in the past, the index has moved lower.

Tradable assets:
Min.Deposit:
Max Leverage:
FCA:

Rating:


