Test- FTSE 100 Kicks Off August on a High as BP and Senior Lead Market Momentum
$11
10 Oct 2025, 13:13
Neutral
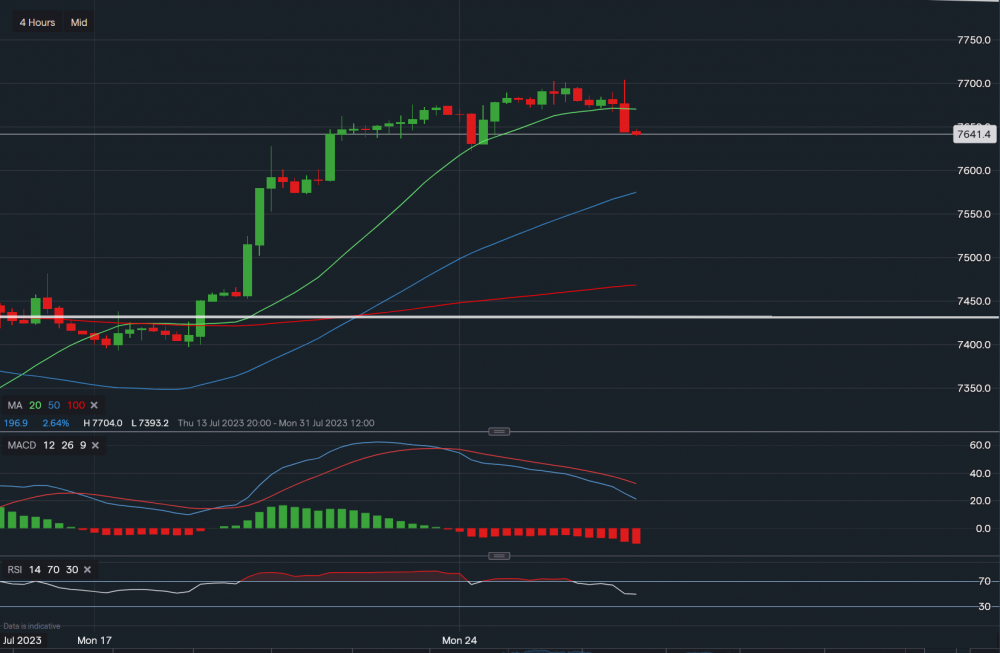
Chart & Data from IG
The FTSE 100 index has just fallen below the 20-day moving average on the 4-hourly timeframe, currently trading at around 7,641. We are now looking at support sitting at 7,622 - a break and close below could see the index slide lower towards the support levels sitting along the 50 & 100-day moving averages. Or alternatively, 7,574 & 7,468, though this may take up to a couple of days. As the bias in the short-term has now turned bearish, we will not analyse the upside unless we see some consolidation. Looking at the technical indicators, MACD is negative and volume is rising and the RSI has now turned neutral as it reads 48.


