Test- FTSE 100 Kicks Off August on a High as BP and Senior Lead Market Momentum
$11
10 Oct 2025, 13:13
Neutral
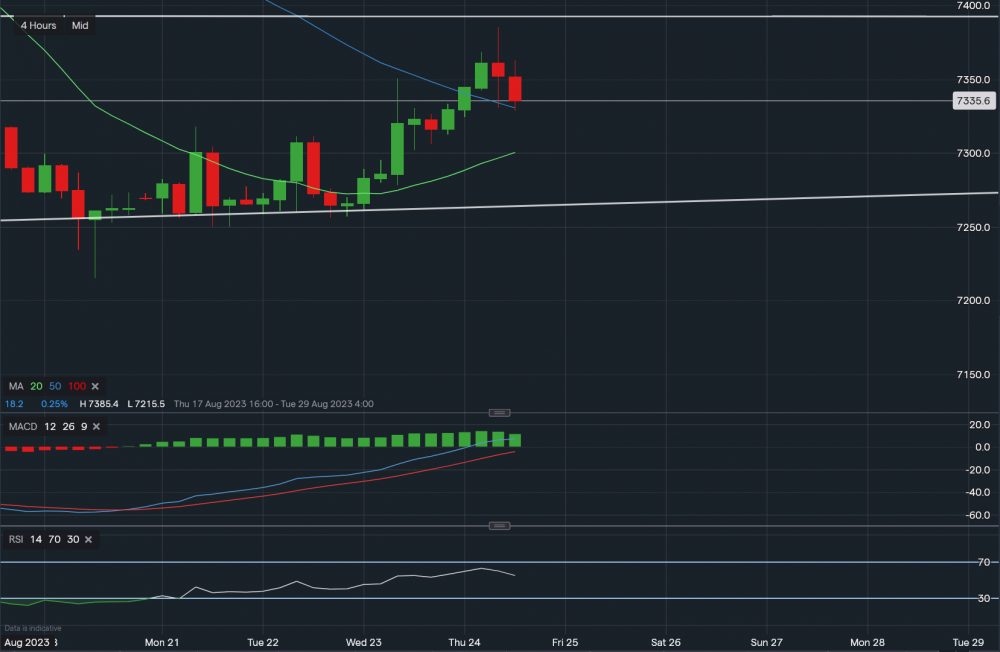
Chart & Data from IG
Taking a look at the FTSE 100 after its recent bounce higher, currently trading at around 7,335. The index tried to break higher almost reaching the resistance of 7,394 but soon retraced, it may be likely that the bullish momentum is running out of steam. The UK data this week has shown further weakness in the British economy and we could see further moves lower going into the end of the week. Support now sits at 7,330 (50-day MA) and then at 7,300 (20-day MA). A break below the 20-day moving average could see the FTSE slide lower towards the key support level 7,215 formed last Friday. At this moment in time, the upside is limited and we would only look higher if the index broke the resistance of 7,385 (today’s high) and then 7,394. Looking at the technical indicators, MACD is positive but volume seems to be stalling and the RSI is now starting to falter as it reads 54.

Tradable assets:
Min.Deposit:
Max Leverage:
FCA:

Rating:


