Test- FTSE 100 Kicks Off August on a High as BP and Senior Lead Market Momentum
$11
10 Oct 2025, 13:13
Neutral
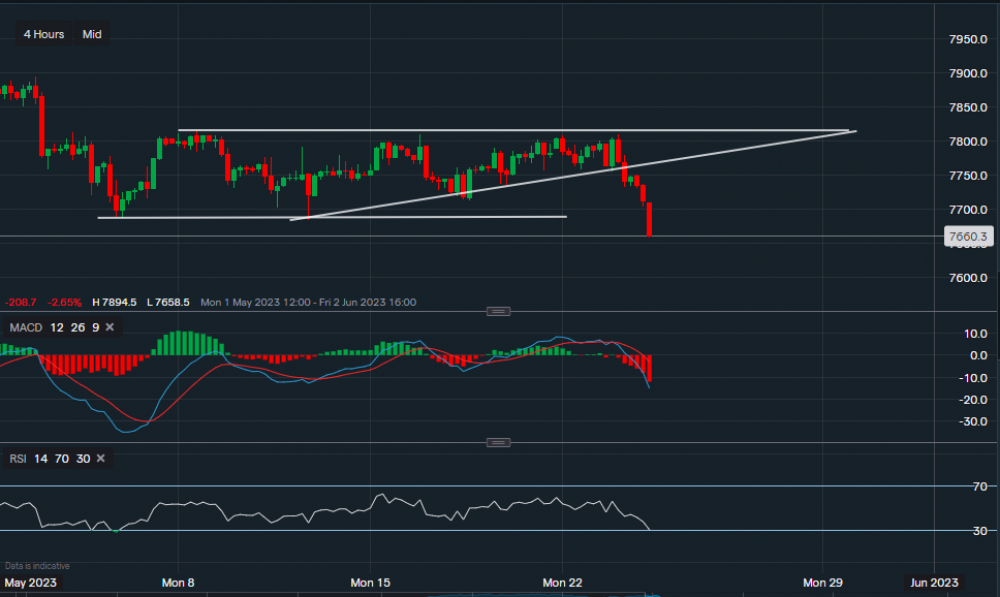
Chart & Data from IG
FTSE 100 falling off a cliff after the most recent publication of inflation data. The index is now trading at around 7,660 and is currently down 1.4%. We can see that on the 4-hourly timeframe, it has pierced through the support sitting at 7,683 and is now heading lower. The next level of support sits at 7,624. A break below 7,624 could see a fall to as low as 7,500. The previous support level of 7,683 is not acting as the resistance point, a move above it could see a correction higher towards 7,730-7,740. However, the bias now is bearish until there are signs of consolidation. Looking at the technical indicators, the MACD is strongly negative and so is the RSI as it reads 29. Though the RSI is entering ‘oversold’ territory.

Tradable assets:
Min.Deposit:
Max Leverage:
FCA:

Rating:


