Test- FTSE 100 Kicks Off August on a High as BP and Senior Lead Market Momentum
$11
10 Oct 2025, 13:13
Neutral
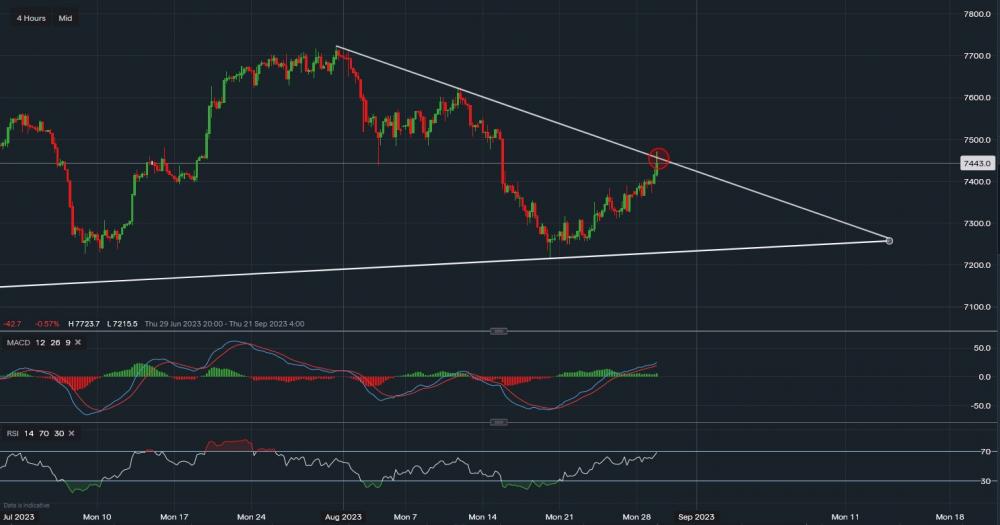
Chart & Data from IG
We can see the FTSE 100 has now approached the resistance zone within the triangle drawn on the chart (7,452 - red oval). Currently, the index is trading at around 7,443, It did test the resistance reaching a high of 7,471 but soon retraced. A break and close above this resistance level could indicate that a move higher is possible, with the next level of resistance then at 7,524. Towards the downside, we can see various support levels within this bullish trend, support sits at 7,393 then at 7,371, and then at 7,360. A break below 7,360 would then face the support of 7,325, a move below 7,325 would suggest that the longer-term bearish trend has resumed. Looking at the technical indicators, both indicators are positive with the RSI reading 66.

Tradable assets:
Min.Deposit:
Max Leverage:
FCA:

Rating:


