Test- FTSE 100 Kicks Off August on a High as BP and Senior Lead Market Momentum
$11
10 Oct 2025, 13:13
Neutral
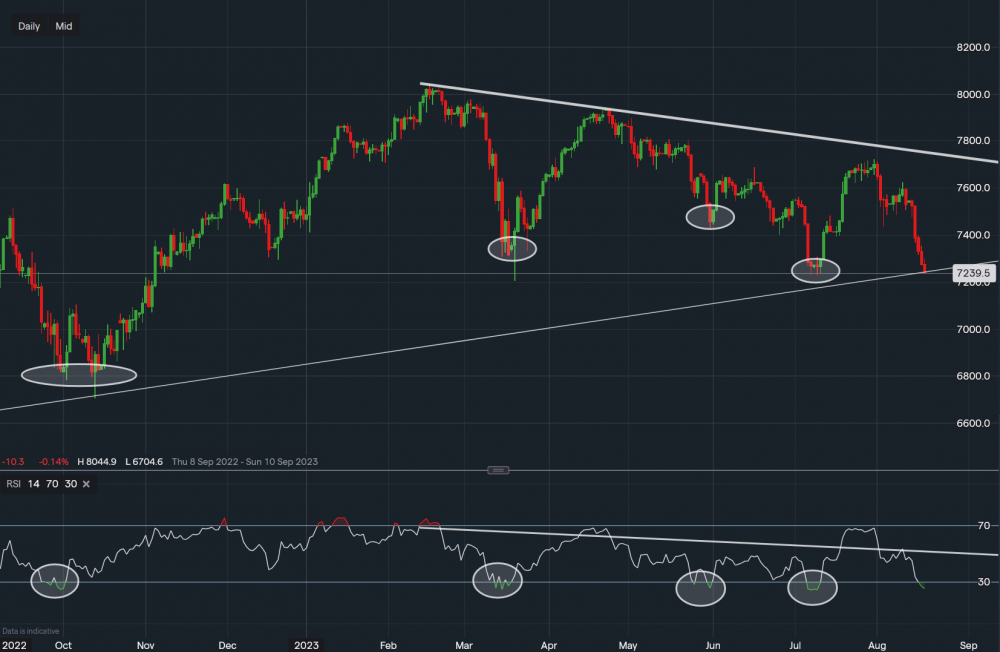
Chart & Data from IG
Taking a look at the FTSE 100 as it has approached the key supportive trendline level dating back to November 2020, currently trading around 7,239. It has actually already dipped below it today but the important factor to monitor is whether it will close below it. There are two further support levels that may also be tested, these sit at 7,227 followed by 7,203. A break below 7,203 could see the index slide lower towards around 7,000. On the other hand, we could see a little bounce higher as the last 4 times the index has reached such a setup, but based on the technicals, it has bounced back. The ovals highlight what has happened in the past, since September 2022, every time the FTSE has reached oversold levels on the daily timeframe it has managed to recover the following days. Of course, there is no guarantee that this will happen again. Although on 4 of those occasions, consolidation happened on/around the Friday and the bounce occurred in the few days of the following week. MACD is still strongly negative and the RSI reads 25.

Tradable assets:
Min.Deposit:
Max Leverage:
FCA:

Rating:


