Test- FTSE 100 Kicks Off August on a High as BP and Senior Lead Market Momentum
$11
10 Oct 2025, 13:13
Neutral
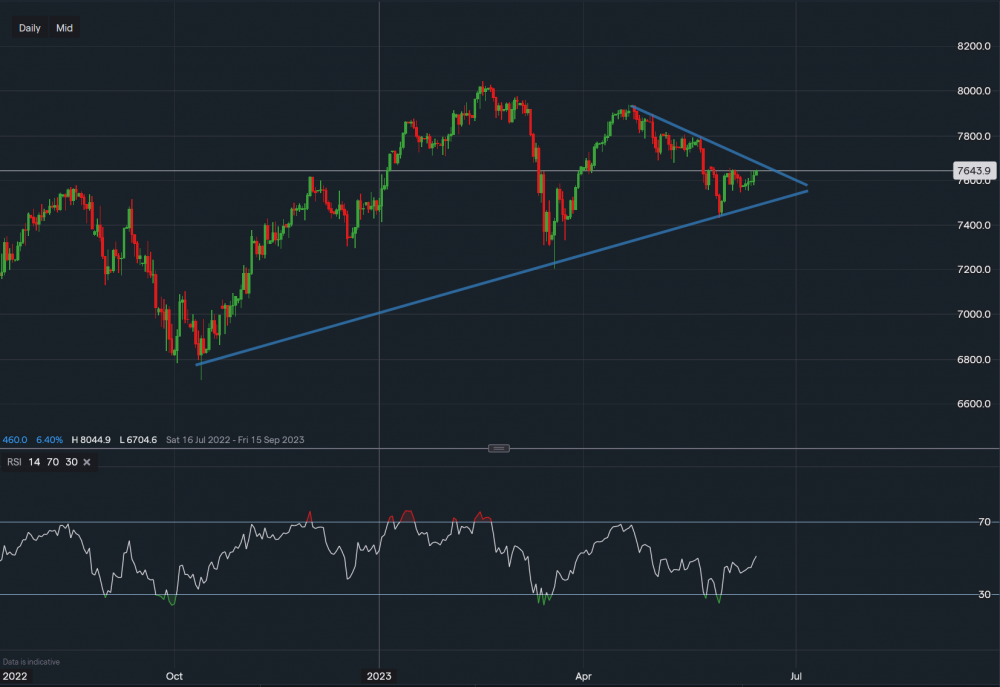
FTSE100 - Chart data IG
The FTSE continues to trade within its symmetrical triangle pattern with a possible upside breakout coming soon as the market looks to test the highs. Risk appetite remains strong and this can be seen across all markets. Looking more in-depth at the FTSE minor resistance for the index sits at 7,670 with a break above here a further move towards 7,732 followed by 7,813 could seem feasible. A breakdown below 7,550 could see the index drop towards 7,450.

Tradable assets:
Min.Deposit:
Max Leverage:
FCA:

Rating:


