Test- FTSE 100 Kicks Off August on a High as BP and Senior Lead Market Momentum
$11
10 Oct 2025, 13:13
Neutral
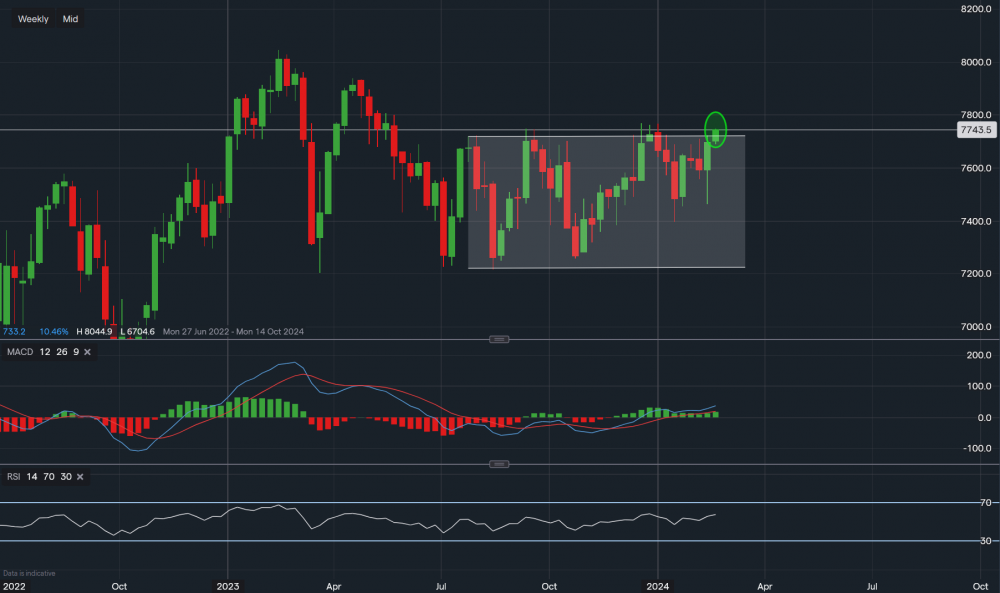
Chart & Data from IG
The FTSE 100 seems like it is trying to breakout here on the weekly timeframe following positive momentum from the banks and Governor Bailey hinting that easing of rates could even be possible in 2024. Currently, the index is trading at around 7,744 with a possible channel breakout towards the upside. The resistance here sits at 7,769, in theory, a break and close above this level would indicate a possible start to a bullish trend. This would then allow investors to eye up 7,876-7,938. The support here now is the previous channel resistance of 7,717. A dip back into the channel would suggest that there still isn’t enough momentum for a successful move higher. This would then turn the focus to support levels of 7,622 and then 7,545. Looking at the technical indicators, the MACD is positive with the RSI on the rise as it reads 57.

Tradable assets:
Min.Deposit:
Max Leverage:
FCA:

Rating:


