Test- FTSE 100 Kicks Off August on a High as BP and Senior Lead Market Momentum
$11
10 Oct 2025, 13:13
Neutral
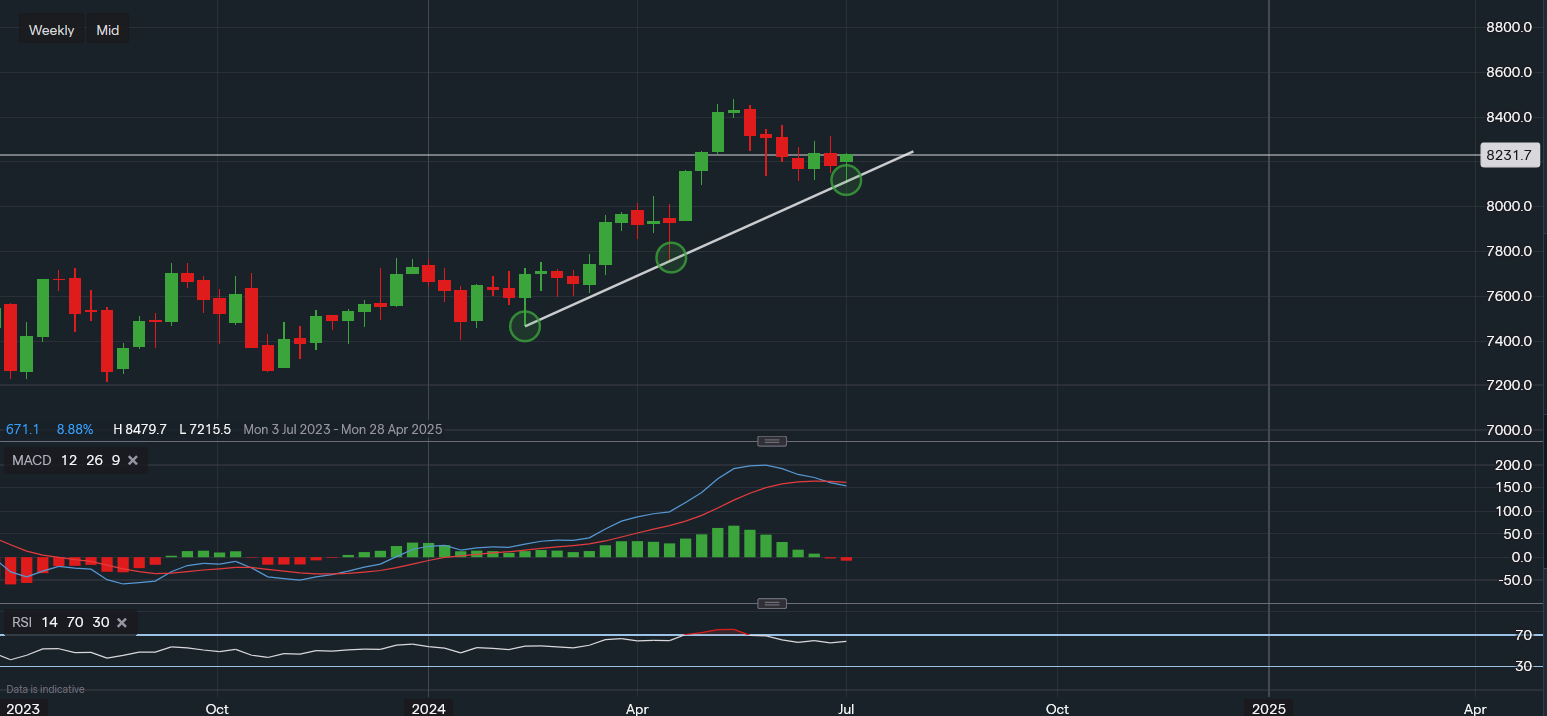
Chart & Data from IG
FTSE 100 is up 0.7% on the day as voting for the election begins. Currently, the index is trading at around 8,231 in the session, with what looks like a potentially new area of support forming on the weekly chart. We can see that the trendline is acting as the first line of support here, with the previous support levels highlighted by the green ovals. If the current consolidation phase can establish itself, then a push toward the all-time high of 8,479 will be likely. Though there are minor resistance levels along the way at 8,314 followed by 8,364. The near term support is this week’s low of 8,105 (along trendline), a break below could see traders look towards 8,000 as the next psychological area of support. The technical indicators are a little mixed heading into the election, which can be expected. The MACD has turned negative, suggesting that bullish momentum is fading. However, the RSI is still positive and not falling as It reads 61. Looking at the history of the chart, we can see that the MACD positioning can be used as a guide but it’s not always accurate for future market movements. For example, in October of 2023, the MACD turned negative just before the FTSE bottomed out, it then went on to rally to new highs.
Note: Market volatility can be on a much higher scale than usual during the period of an election.

Tradable assets:
Min.Deposit:
Max Leverage:
FCA:

Rating:


