Test- FTSE 100 Kicks Off August on a High as BP and Senior Lead Market Momentum
$11
10 Oct 2025, 13:13
Neutral
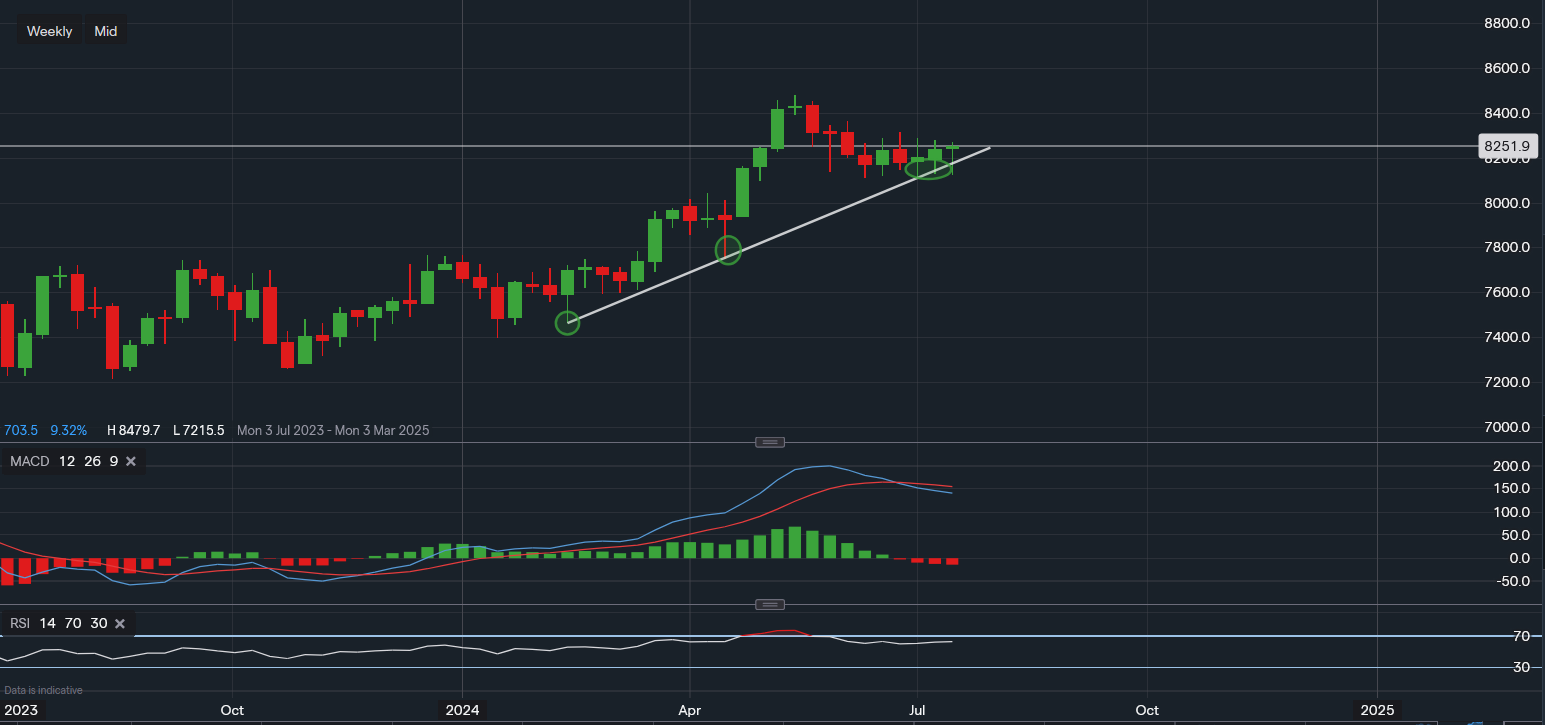
Chart & Data from IG
FTSE 100 seems like the consolidation phase is still taking place but with a slight bias toward the upside favouring the bulls. From a technical outlook, we can see on the weekly chart the index is currently trading at around 8,251. The support along the trendline so far is proving to be robust as there have been two attempts to move lower but have both been rejected. This week is on track to close as the third consecutive week in the green, which in theory would strengthen the view of a potential move back up to the all-time highs. The nearest resistance is at 8,314, a break above here would certainly favour the bulls with then a possible extension towards 8,479 once again. The support is along the trendline reading 8,174. A break and close below this level would then require a move below 8,095 for the bears to re-take control. This would create some concerns for investors in the short-mid term, The technical indicators are a little mixed as the MACD is negative and the RSI is positive, however, the MACD volume is currently low.

Tradable assets:
Min.Deposit:
Max Leverage:
FCA:

Rating:


