Test- FTSE 100 Kicks Off August on a High as BP and Senior Lead Market Momentum
$11
10 Oct 2025, 13:13

Chart & Data from IG

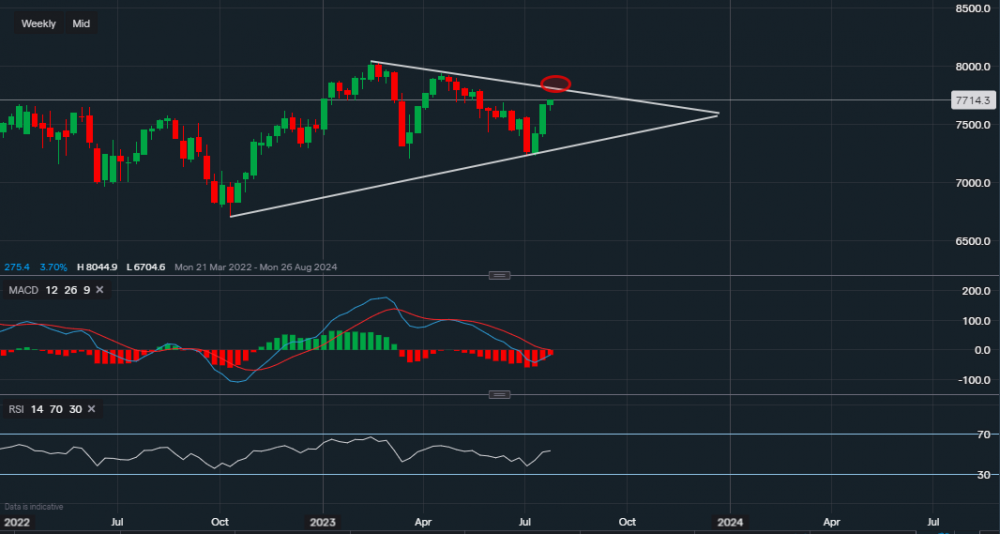
Taking a look at the FTSE 100 as the index continues to rise after the sentiment boost from other markets around the world. Some world economies are starting to show improvements as well as moving away from recession fears. In the US, GDP came in better than expected alongside the positive comments from the Fed, though they mention one further hike may be needed in months to come. ECB followed suit, positive comments from President Lagarde boosted markets after she portrayed a dovish outlook by stating that vigorous interest rates may no longer be necessary. The Bank of England is expected to announce its monetary policy decision next week, with analysts pricing in a 25 basis points increase.
Currently, the FTSE is trading at around 7,714, we can see that on the weekly interval, it is now approaching a resistance level of 7,800 highlighted by the red oval (along the upper trendline of the triangle). This will be a tough level to overcome, though if we see a clear break and close above, then we would look towards resistance sitting at 7,876 then at 7,938 and then the all-time high of 8,044. This can be classed as the mid-longer term outlook and would require serious momentum as well as economic data which demonstrates improvements for the UK. If resistance is overpowering, then support below sits at 7,622 followed by 7,545 and then 7,432. A break below 7,432 may pull the index lower towards the lower trendline (approx. 7,364). Looking at the technical indicators, MACD is still slightly negative but heading for the neutral stance and RSI is now neutral as it reads 53.