Test- FTSE 100 Kicks Off August on a High as BP and Senior Lead Market Momentum
$11
10 Oct 2025, 13:13
Neutral
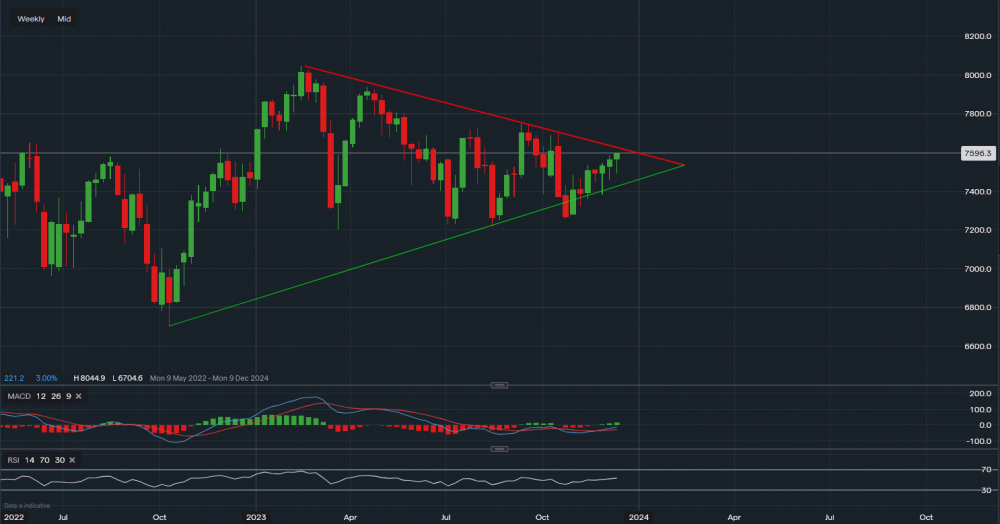
Chart & Data from IG
Weekly outlook on the FTSE100 index as it is approaching a key resistance level here. We can see that the triangle pattern is still in play after the index tested the support base of 7,200-7,250 on several occasions. A dip below the supportive trendline (green) did occur back in October trapping some bears, however, it now seems like it was a false breakout. Since then, the FTSE has bounced back and now faces the resistance of 7,634 in a week packed with inflation data and central bank meetings. Currently, the FTSE is trading at around 7,596. A break and close above the resistance of 7,634 (along the red trendline) would perhaps be a bullish indication, which may see the index rise higher. In that scenario, the next resistance target for the bulls sits at 7,702 followed by 7,747. The support now is situated in this week’s low of 7,492. A break below it would in turn shift the focus back towards the supportive trendline where support is reading 7,435. Looking at the technical indicators, the MACD has turned positive and is rising. The RSI reads 53, suggesting neutral but also on a small rise.

Tradable assets:
Min.Deposit:
Max Leverage:
FCA:

Rating:


