Test- FTSE 100 Kicks Off August on a High as BP and Senior Lead Market Momentum
$11
10 Oct 2025, 13:13
Neutral
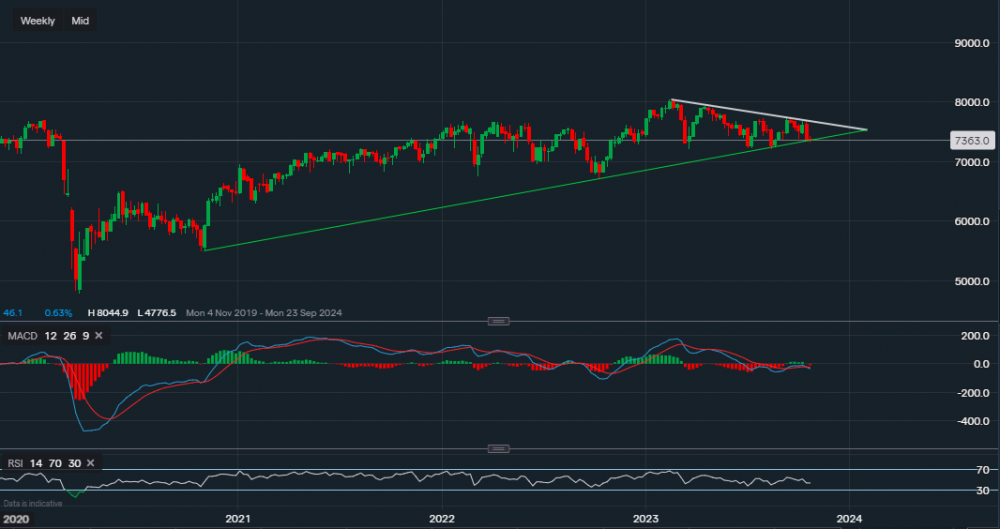
Chart & Data from IG
Taking a look at the FTSE 100 index as it has approached a key support level of 7,324, which sits along the green trendline. This supportive trendline dates back to October 2020 and we can see that it has been tested on two occasions now this week, but so far, it has managed to hold out despite the falls within the banking sector. A break and close below the trendline could suggest that the downside pressure is overpowering leading to a move lower. In that case, we would then look at the support sitting at 7,215, which is August’s low point. On the other hand, as the FTSE seems like it’s consolidating, this may be a stall before another attempt to push higher ahead of the Bank of England rate decision next week. Therefore, the key resistance is this week’s high of 7,430. A break and close above it, particularly on the daily timeframe, may indicate that further upside is possible with the target then ranging between 7,480-7,500. The technical indicators do currently support the bearish bias, suggesting more downside. However, they are lagging indicators and short-term momentum is not always recognised and so can be misleading. The MACD is negative and so is the RSI as it reads 37.
 (Chart & Data from IG)

Tradable assets:
Min.Deposit:
Max Leverage:
FCA:

Rating:


