Test- FTSE 100 Kicks Off August on a High as BP and Senior Lead Market Momentum
$11
10 Oct 2025, 13:13
Neutral
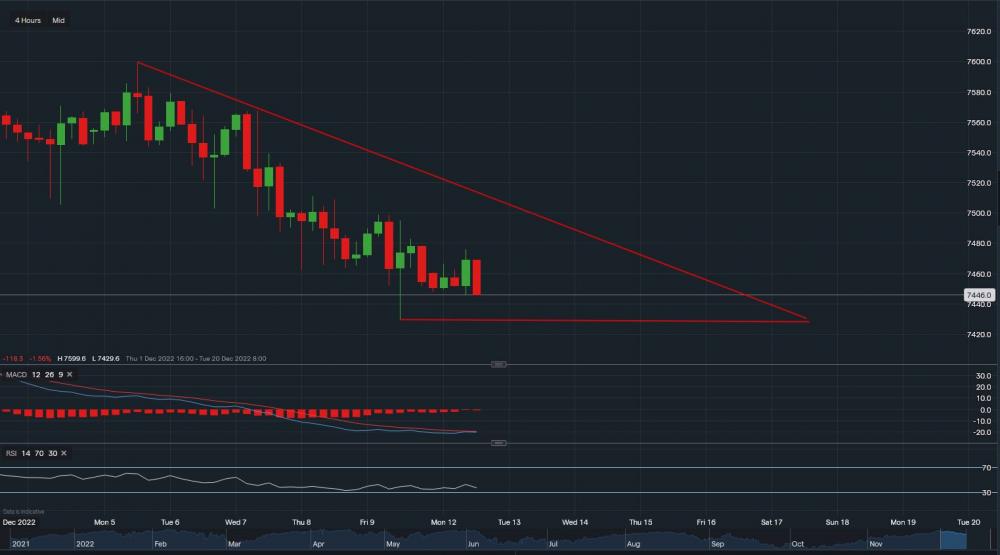
FTSE100 - Chart & Data from IG
From a technical perspective, the FTSE100 is currently trading around 7446. Looking at the 4-hourly timeframe, a key support level sits at 7429 which corresponds with the lower red trendline. A break below this support trendline could see the index slide further towards the range of 7400-7420 min the short term. If the support holds and a reversal trend is starting to form, resistance sits at 7461 then at 7466 then at a tougher level of 7476. A break above 7476 may spark an uptrend and see the index head towards 7500. Looking at the indicators, MACD is slightly negative and seems to be flattening but RSI is strongly negative as it reads 36.

Tradable assets:
Min.Deposit:
Max Leverage:
FCA:

Rating:


