Test- FTSE 100 Kicks Off August on a High as BP and Senior Lead Market Momentum
$11
10 Oct 2025, 13:13
Neutral
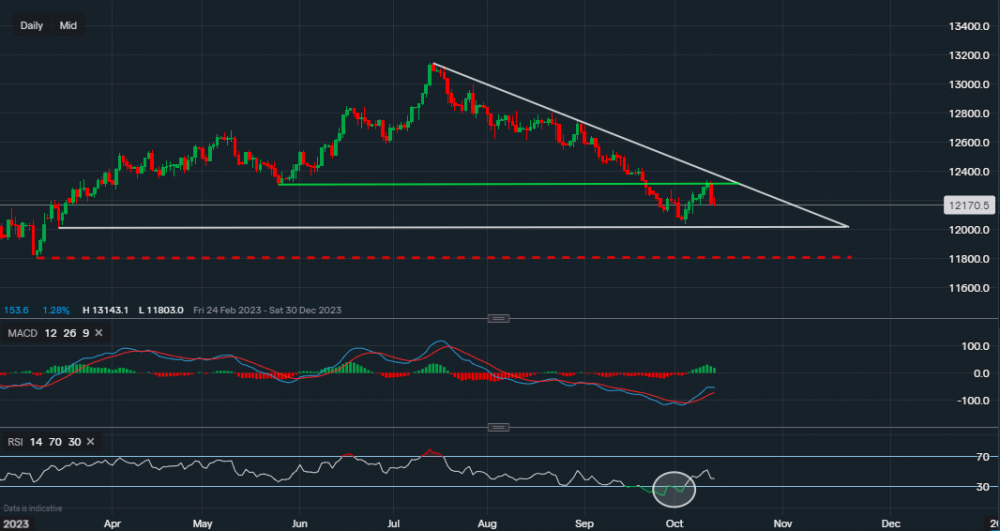
Chart & Data from IG
Sterling was hit yesterday against the dollar after the hotter-than-expected inflation data. After 6 strong green days, the forex pair closed yesterday’s session at £1.2179. It is currently trading at around £1.2170; we can see that it reached a resistance level of £1.2308 (previous support – green trendline), but the resistance was overpowering which added pressure towards the downside. The support now sits at £1.2163 then at £1.2107. A break below these levels could see the pound slide lower back towards the support of £1.2037 (last week’s low), which was formed just above the key support of £1.2010 (white trendline). If the pound manages to consolidate around current levels in today’s session, we may see next week begin on a positive note. Resistance for the time being sits at £1.2225 (today’s high) followed by £1.2261. A break and close above £1.2261 could see the forex pair stretch towards the resistance of £1.2309, which sits along the white descending trendline. If we look at the technical indicators, the MACD is still positive but the MACD line has narrowed in closer to the signal line, and after yesterday’s session, the RSI is now negative as it reads 40.

Tradable assets:
Min.Deposit:
Max Leverage:
FCA:

Rating:


