Test- FTSE 100 Kicks Off August on a High as BP and Senior Lead Market Momentum
$11
10 Oct 2025, 13:13
Neutral
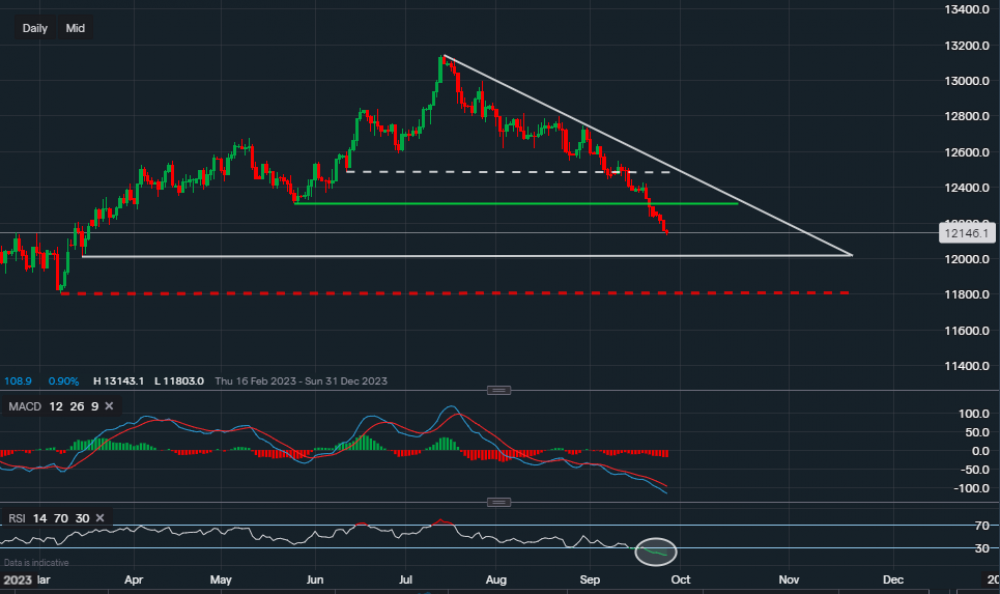
Chart & Data from IG
Taking a look at sterling vs dollar, also known as cable, as sterling has been getting hammered since the back end of July now. Currently trading at around £1.2146 against the dollar, the pound has now broken through yet another support level (£1.2308 – green trendline) and it’s now heading towards the support of £1.2010. This support of £1.2010 (lower trendline of the white triangle) is the next key level as a break below it may see a further extension towards £1.1800 (red dotted trendline). If the support of £1.2010 is upheld and the price shows signs of consolidation, then we will look at potential resistance levels. This is due to the reason that the bias remains bearish and there currently are no indications of any reversal trends. We would only reevaluate if consolidation occurs around current levels as any upside for the time can be argued as high risk. The technical indicators coincide with this bias as the MACD extends in the red with medium-sized volume, and the RSI reads 17. However, the RSI is suggesting that the forex pair is heavily oversold, The last time the RSI was this oversold on this market was back in September of last year when sterling hit its all-time low, this was followed then by a big bounce back. Hence, this is a key factor for traders and investors to monitor.

Tradable assets:
Min.Deposit:
Max Leverage:
FCA:

Rating:


