Test- FTSE 100 Kicks Off August on a High as BP and Senior Lead Market Momentum
$11
10 Oct 2025, 13:13
Neutral
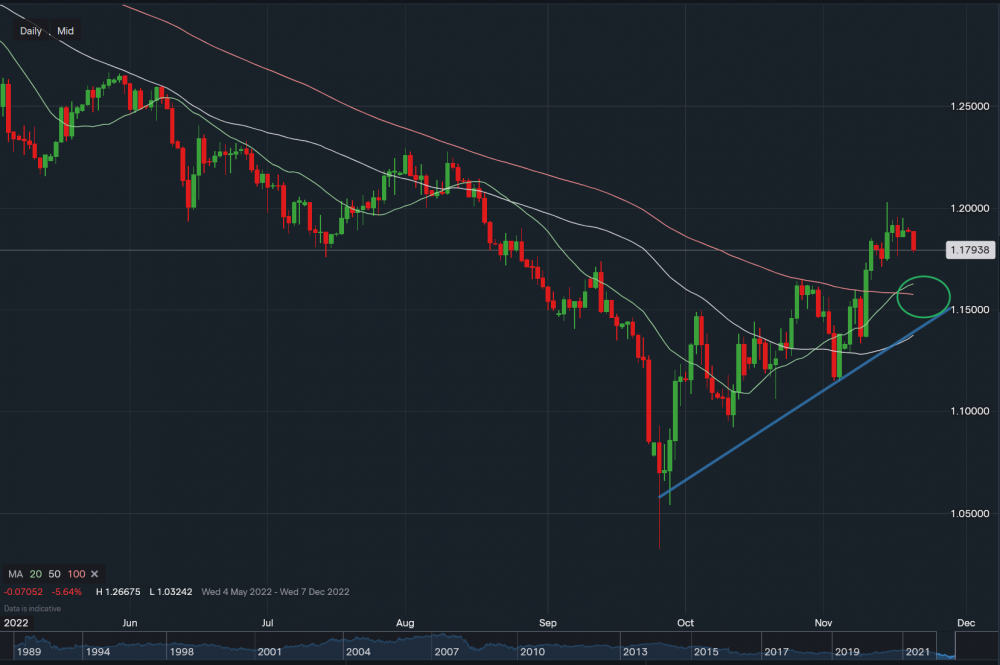
GBP/USD - Chart & Data from IG.
From a technical perspective, the pound is currently trading at £1.1793. On the daily timeframe, in comparison to the previous candlesticks, a large red candlestick has appeared suggesting a bearish movement. Towards the downside, support sits at £1.1763 then at £1.1741 then at £1.1710. A break below these support levels could see the pound slide towards the £1.1600-£1.1650 price range, which corresponds with the 20-day moving average (green MA). The blue trendline also suggests a move towards the downside as it matches the movement of the 50-day moving average, creating support along the way. Towards the upside, resistance sits at £1.1904 then at £1.1942 then at £1.1958. A break above these resistance levels may see the sterling climb towards the major resistance at £1.2029. Looking at the indicators, MACD is curving towards the negative direction and RSI is faltering as it now reads 57.

Tradable assets:
Min.Deposit:
Max Leverage:
FCA:

Rating:


