Test- FTSE 100 Kicks Off August on a High as BP and Senior Lead Market Momentum
$11
10 Oct 2025, 13:13
Neutral
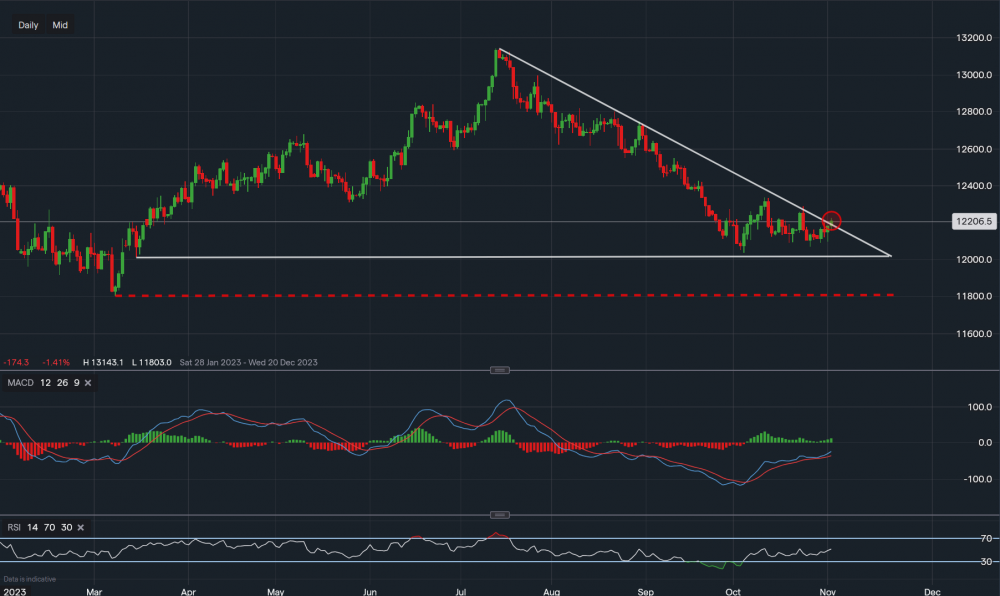
Chart & Data from IG
Taking a look at the sterling vs dollar pair after the Bank of England decided to keep rates at 5.25% for the second consecutive time. Currently, the forex pair is trading at around £1.2206, we can see that it has now approached the trendline resistance of £1.2186. The session is yet to finish, but a close above the trendline may be a bullish indication. In that case, we would look towards resistance levels sitting at £1.2288 and then at £1.2337. A break and close above £1.2337 would allow the bulls to eye up the £1.24-£1.25 area once again. However, false breakouts can occur, therefore, traders should be cautious when opening positions until more clarity is visible. Perhaps a move above the resistance of £1.2288. The previous resistance of £1.2186 shall now act as support, a move back below this level would then see support at £1.2143 and then at £1.2110. Looking at the technical indicators, the MACD remains in the positive tone with the RSI now on the rise as it reads 51.

Tradable assets:
Min.Deposit:
Max Leverage:
FCA:

Rating:


