Test- FTSE 100 Kicks Off August on a High as BP and Senior Lead Market Momentum
$11
10 Oct 2025, 13:13
Neutral
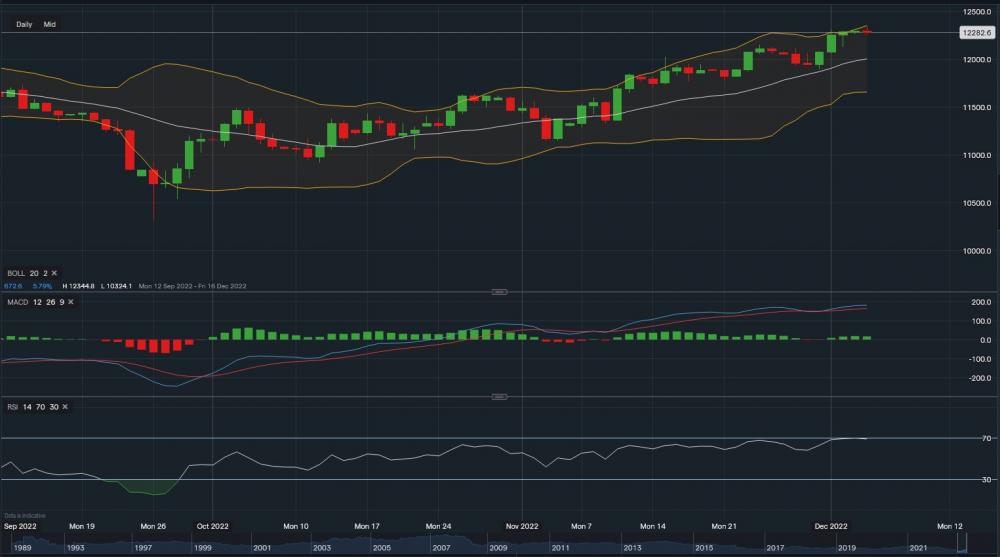
GBP/USD - Chart & Data from IG
From a technical aspect, the pound is currently trading at £1.2282 against the dollar. It has been in an uptrend since the 28th of September, and the upper Bollinger Band is now acting as resistance (£1.2355) A break above the upper Bollinger Band could see the FX pair head towards the £1.24 price level. Towards the downside, support sits at £1.2134 then at £1.2070 then at £1.2007 (correspondent to the middle moving average of the Bollingers). A break below the moving middle average may see the pound fall towards £1.1661 versus the dollar, which is where the lower Bollinger Band is currently sitting at. Looking at the indicators, MACD is slightly positive and RSI is also positive as it reads 69. However, RSI is floating just below 'overbought' territory, suggesting a potential dip might occur before heading any higher or the forex could enter a neutral position.

Tradable assets:
Min.Deposit:
Max Leverage:
FCA:

Rating:


