Test- FTSE 100 Kicks Off August on a High as BP and Senior Lead Market Momentum
$11
10 Oct 2025, 13:13
Neutral
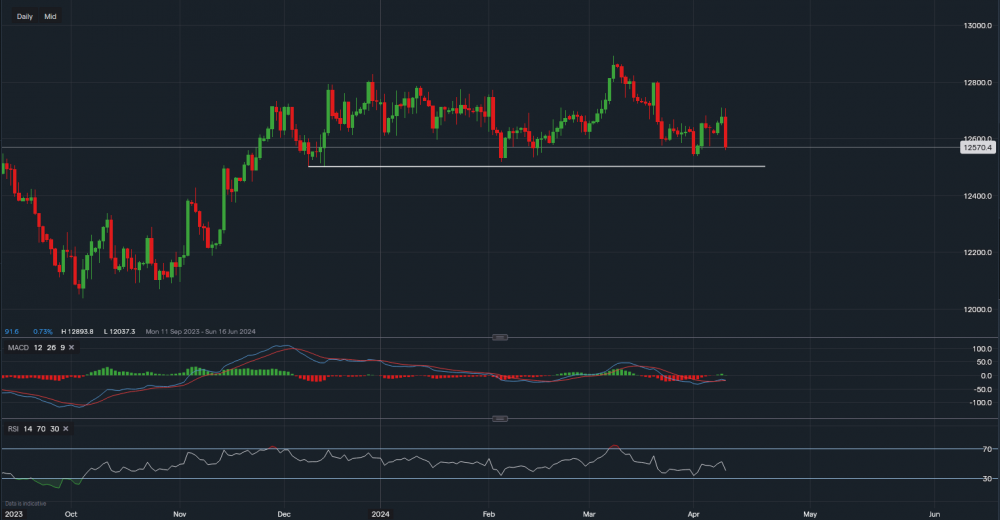
Chart & Data from IG
Taking a look at the GBP/USD pair after the US CPI print which has strengthened the US dollar. Now, the pound is trading at around £1.2570 against the dollar. Looking at the daily chart, we can see that after that data has led to a sell-off with the pair now down 0.8% on the day, a further sell-off towards the key trendline drawn may be underway. The support along the trendline reads £1.2500, the pair has already come close to this support on three separate occasions. Every time, it has consolidated before moving back up. It is not guaranteed that this will happen again as the dollar should gain some momentum after the latest print, however, this is also a clear strong support zone. A break below and close below would certainly increase the likelihood of a sell-off toward £1.24. It would be unreliable to point out any resistance levels as the near-term bias has now shifted bearish. Unless there are signs of consolidation. The MACD seems like it now could turn negative and the RSI has faltered heavily, reading 41.

Tradable assets:
Min.Deposit:
Max Leverage:
FCA:

Rating:


