Test- FTSE 100 Kicks Off August on a High as BP and Senior Lead Market Momentum
$11
10 Oct 2025, 13:13
Neutral
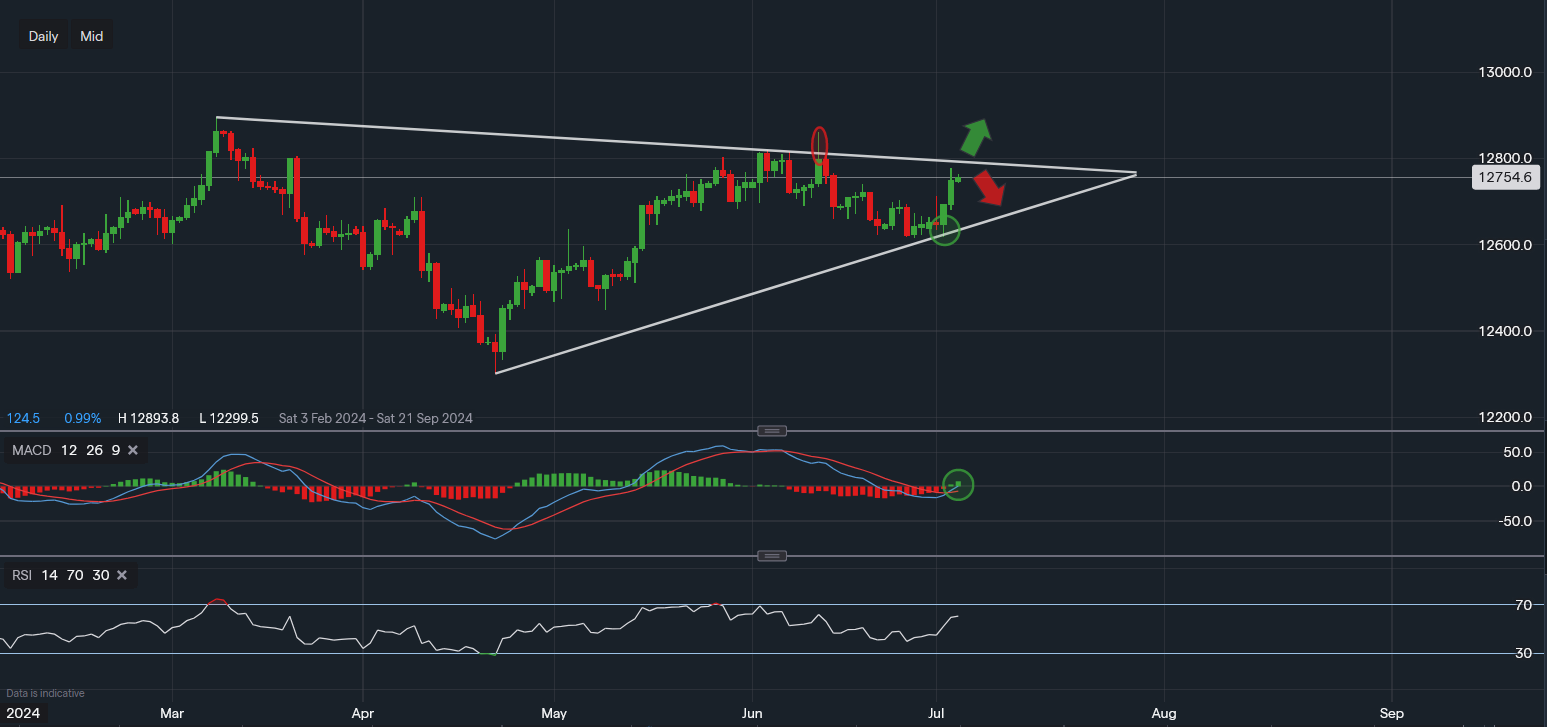
Chart & Data from IG
Sterling has consolidated over the past week with a jumper over the past couple of days leading to election day. Currently, the pound is trading at around £1.2754 against the US dollar. Looking at the daily chart, it is looking optimistic for the bulls with the pair finding a new support level around £1.2615 at the start of the week. The resistance here now is along the descending trendline of the triangle, reading £1.2792. A convincing move above the trendline will be required to increase the probability of a breakout as we can see on the 12th of June the market deceived traders. A strong breakout may then see £1.2860 followed by £1.2814 challenged before any further rallies. Towards the downside, if a rejection of a move higher were to occur, a pullback to the lower trendline would be likely. The area around £1.2664 may then become the main point of focus. As the data over in the US weakens the dollar by maintaining hopes of a Federal Reserve rate cut in September, the pound may gain an advantage in the short term. Heading over to the technical indicators, the MACD has just turned positive and the RSI is comfortably in the bullish territory as it reads 60.

Tradable assets:
Min.Deposit:
Max Leverage:
FCA:

Rating:


